Graph of forces
Presentation
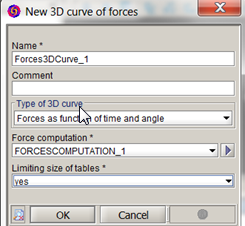
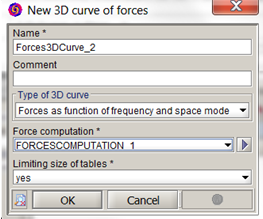
Two 3D curves are created after a force computation.
The 3D curves are:
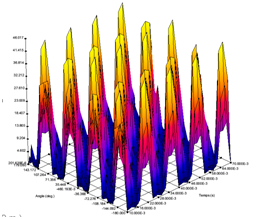
- The efforts F(t, θ ) : forces depending on time and position
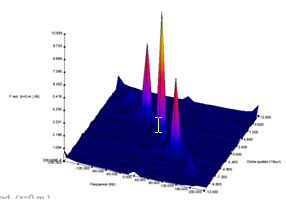
- Its harmonic spectrum depending on frequency and spatial order
The command to plot the 3D curves is available through the menu or through the icon ![]()
3D curves
The two 3D curves are presented here:
|
|
|
|
Note: Remark 1: It is recommended to not limit the 3D table size (last line of the curve
creation box), when it is possible: when the data quantity is not too important. In fact,
this option have a consequence to delete a part of the data, what can have an influence on
the results. But in case of important data quantity, user may be obliged to limit the
tables size (the curve creation can freeze the application).
Note: Remark 2: when the fundamental amplitude is much higher than other harmonics amplitudes,
it could be useful to modify the maximum displayed value by decreasing it, in order to
display the other harmonics..
Note
Graph values can be exported in a text or xls file through the menu