Display Properties
Use the options in the display properties microdialog to define post-processing visualizations.
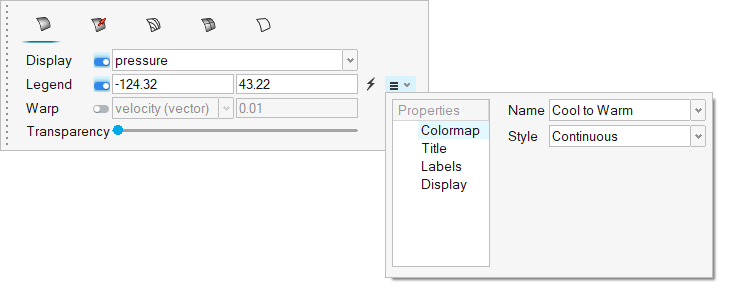
Figure 1.
| Option | Description |
|---|---|
| Surface color display | Tab to define how surfaces are colored. Enable warping to displace the surface in a given direction by a distance controlled by the scale factor and the chosen warp variable. The warp direction is controlled by the following logic:
In both cases, the distance to warp the surface is determined by multiplying the scale factor times the magnitude of the scalar/vector variable that was chosen. To reverse the direction of the warp, simply set the scale factor to a negative value. Boundary surface warping is particularly useful on inlets and outlets. When the surface is warped by the velocity vector, it creates a topographical view of the velocity field. This makes it very easy to see regions of higher velocity and lower velocity flow. This visualization technique can also take the place of a 2D line plot for visualizing a given flow profile. Warping on a slice plane is particularly useful for visualizing the wake velocity deficit behind a bluff body. Warping a surface by a scalar is also useful for visualizing the three dimensional profile of the scalar field. In this case, the displacement direction is determined by the local surface normal. This can lead to confusion when toggling back and forth between the velocity vector (displaced in the direction of the vector field) and velocity_magnitude (scalar displaced in the direction of the surface normal). Also note that the scalars are warped according to their magnitude. Some scalars, such as absolute temperature, have a magnitude that is much higher than any local variation on the surface. In this situation, the surface will warp almost as a rigid body because the displacement is dominated by the magnitude. This can lead to the surface displacing completely off screen. |
| Vector display | Tab to define how vectors on a given object are
displayed. Define a vector scale factor and select a vector display based on magnitude or uniform value. You can also control the resolution of the vector tip and shaft. |
| Contour line display | Tab to define how contour lines on a given object are displayed |
| Mesh line display | Tab to define how mesh lines on a given object are displayed. |
| Feature line display | Tab to define how feature lines on a given object are displayed. |
Click ![]() to reset the legend range values.
to reset the legend range values.
- Color maps and style
- Text properties
- Position of the legend using the Move tool or pre-defined locations