Plot Assistant
Use the Plot Assistant to explore additional representations of results that can be added to the finalization script.
-
From the GUI Utilities ribbon, select the Plot
Assistant.
 The Plot Assistant appears with tabs for plotting data from a delimited file, such as a .csv, or your OML workspace. The 2D line plot is generated on startup using data from the demo_line.csv file.
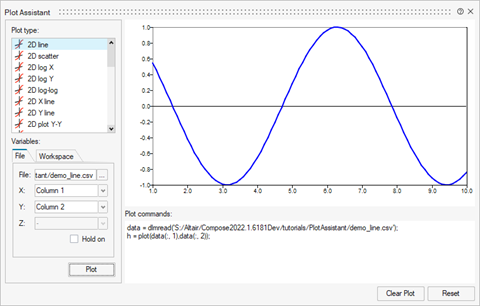
-
Select the data to plot:
To Plot from Do this Delimited file Select the File tab. Any headers in your file are automatically populated in the list of variables: 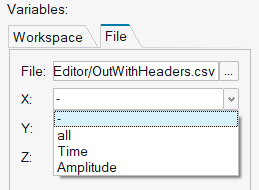
Otherwise, the column number is displayed: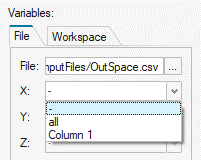
OML Workspace Select the Workspace tab, then select the desired numerical variables for X, Y and Z. 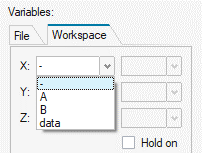
If you select a matrix variable, choose the column to plot: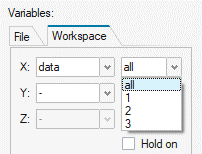
-
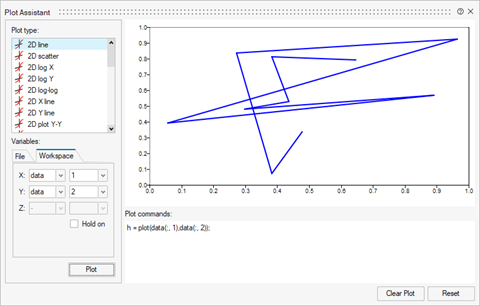
Click the Plot button.
The plot is created based on your data selections:
-
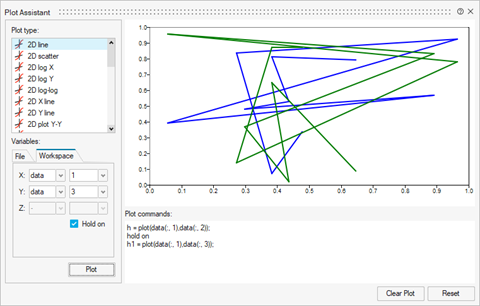
To add a curve to the plot, select Hold on, select a new
variable from the workspace or file, then click Plot
again.
-
To modify a curve display, right-click the curve and use the options in the
microdialog to make your changes.
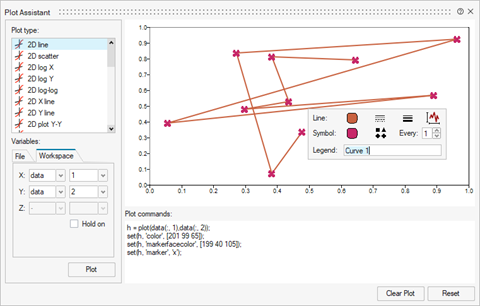
When you modify a plot, the Plot Commands window is updated to reflect the changes. For each change you make in a microdialog, a new
setcommand is added at the end of the Plot Commands. If a property has already been changed and has an entry in the Plot Commands, when you make a new change, the previous entry is removed and a new entry is added at the end of the commands.Some properties will trigger the change of other properties. For example, if you change the axis type from
LineartoLogarithmic, notice that the number of ticks also changes.There are some options in the microdialog that do not have an equivalent property to
set:- "Diagonal labels" in 2D bar plots.
- "Bar labels numeric format", "Bar labels numeric precision" in 2D bar plots.
- "Assign to axis" in 2D line plots.
The microdialog used for
scatter,area,patchandquiveris the same as the microdialog for lines, but the properties are different. For example, in a scatter plot, you can change the line color or line style in the microdialog, but the scatter element doesn't have thecolorandlinestyleproperties.The context menu of the OML Commands menu offers additional options aside from the standard Copy and Select All options:- Run Selection: Evaluates the selected commands.
- Copy to Editor: Copies the selected commands in the active OML script editor.
If an OML script editor does not exist, or if one exists but is not active, a new OML script editor is created and the commands are pasted.
Note: If you run xline or yline commands in an OML script or in the OML Command Window, a line is added in an existing plot. In the Plot Assistant, the plot is cleared before plotting an xline or yline unless the Hold on check box is selected.