Plotting and Visualization
Create 2D and 3D plots and control their style and appearance.
Functionality
| Plot Types and Required Commands | |
|---|---|
|
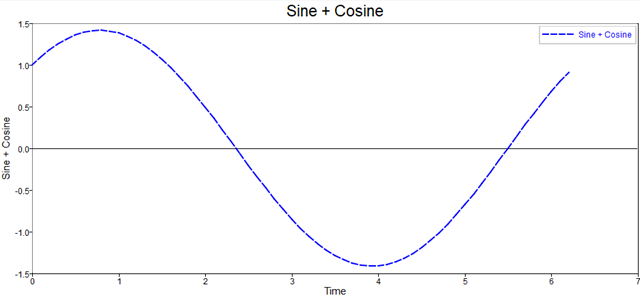
2D and 3D Lines
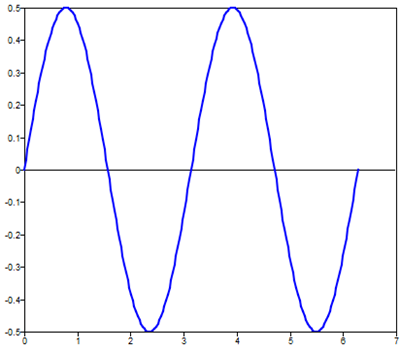 |
2D and 3D Scatter
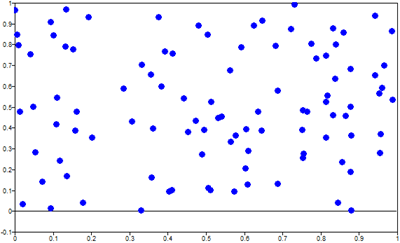 |
2D Contour contour produces a
2D contour.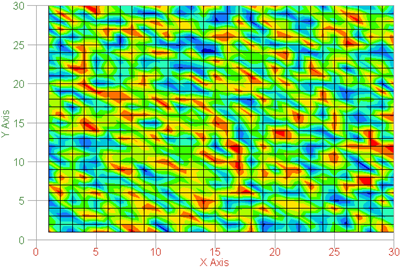 |
3D Contour countour3 produces a
3D contour.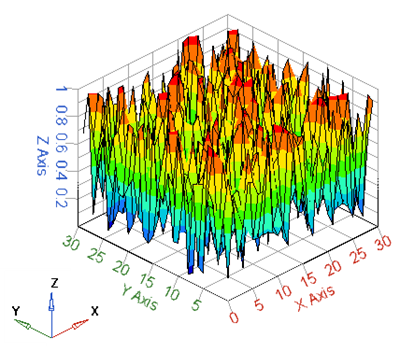 |
3D Surface surf produces a 3D
surface.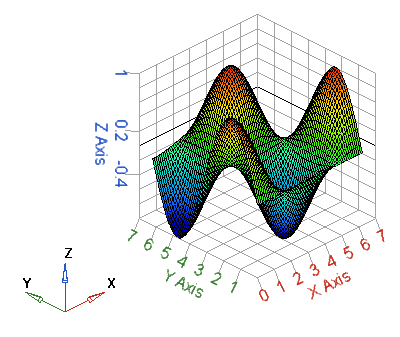 |
3D Waterfall waterfall produces
a 3D waterfall.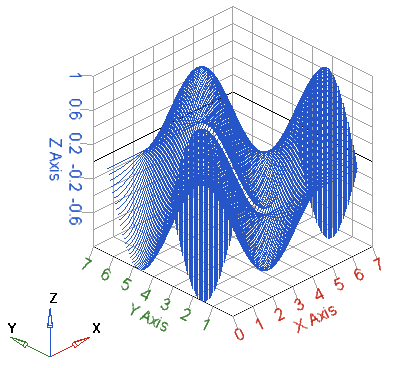 |
2D Log Base 10 log produces a
2D plot with log base 10 in both axes.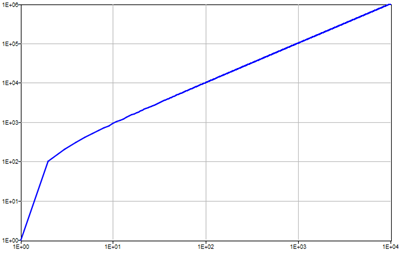 |
Polar polar produces a polar
plot.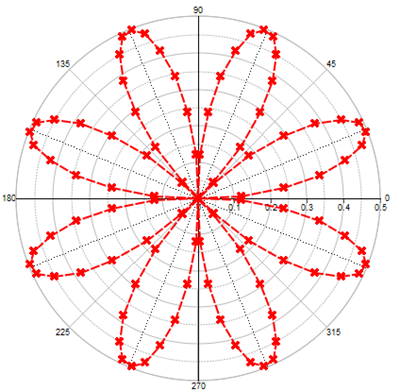 |
One or more plots are contained in the Figure window. When you create a plot, a
figure window is created as well. You can also create a figure window manually with
the figure(n) command:.
The figure(n) command activates the n-th window; the command
close(n) closes that same figure. The command close
all closes all windows.
Style and Appearance
- Color
-
- The default colors for the first three lines in a plot are blue, green and red, respectively.
- To control the line and marker color, enter the appropriate
character code in a format string after the X, Y and Z input vectors.
Color Code Blue b Green g Red r Cyan c Magenta m Yellow y Black k White w 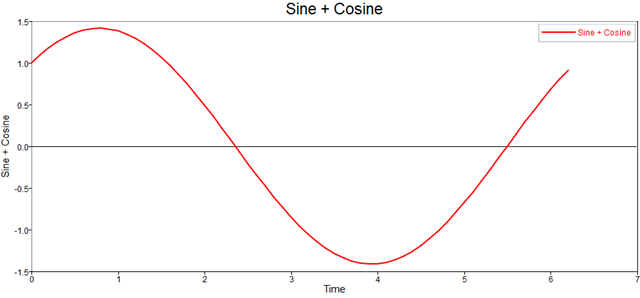
- Markers
- Markers are at the exact locations of the values in the X, Y and Z input
vectors. By default, the markers are not shown. To add a marker, enter the
appropriate character from the following table to a plot format
string.
Coordinate Type Code Point . Circle o x-mark x Plus + Star * Square s Diamond d Triangle (down) 
Triangle (up) ^ 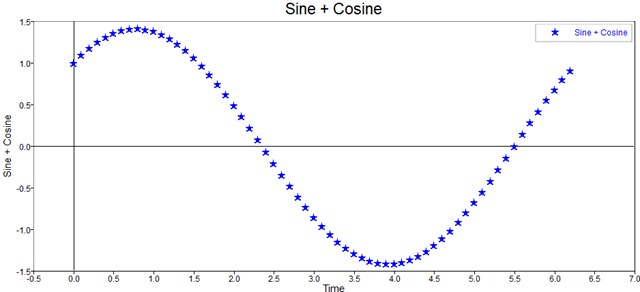
Line Style
The lines within plots are solid by default. To change the line style, add a character from the following table to the data pairs format string.
| Line Type | Code |
|---|---|
| Solid | - |
| Dotted | : |
| Dashdot | -. |
| Dashed | -- |
| (none) | No line is produced. |
titlexlabelylabelzlabellegendlinetextclaclfholdgridaxesaxisboxfillhistmeshxlimylimzlim
Plot Window Management
Define the preference for the windows to be docked or floating: .
To change the current docking state, select the window docking
icon ![]() on the top border of the figure.
on the top border of the figure.
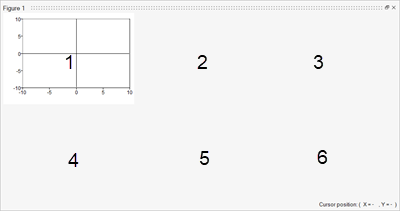
subplot(R, C, N) command creates multiple plots within a single
figure window, where:Ris number of rows of subplots in the window.Cis number of columns of subplots in the window.Nis the active plot number.- and where the plots are numbered from left to right in a row.
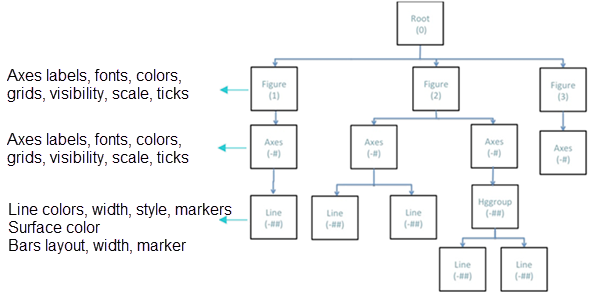
Handles
Plots are considered to be objects in Compose. Each plot
object is assigned a numerical value known as a handle. Similarly
to object-orientated programming, each object has children that can be modified
through the object's handle.
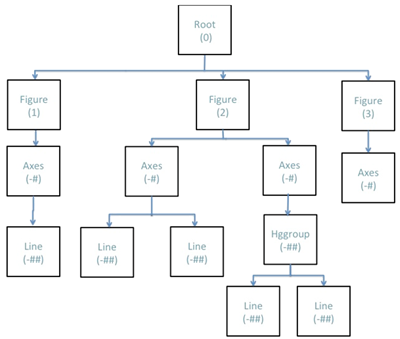
You can modify plots and plot objects programmatically or post plot creation by navigating through the object hierarchy as follows: