Creates a surface and a set of 3D lines defined by the x,
y, and z matrices.
Syntax
h = fanplot(x, y, z)
[sh lh th] = fanplot(..., property, value, ...)
Inputs
x, y, z
Range of the x, y, and z axes..
Type: double | integer
Dimension: matrix
property, value
Only the following properties are accepted:
'curves'
Vector of indices. Specifies the visible curves.
Type: vector
'text'
A cell of strings. Specifies the names of the visible curves.
Type: cell
Outputs
sh
Handle of the surface graphics object.
lh
Vector containing the handles of the line graphics objects.
th
Vector containing the handles of the text graphics objects.
Examples
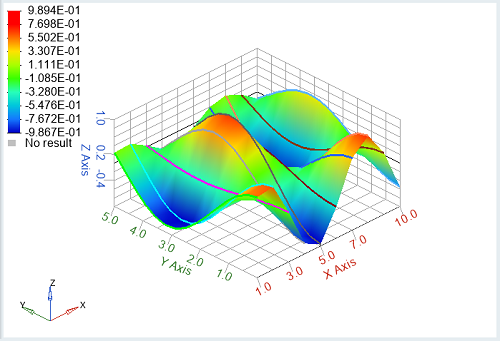
Simple fanplot
example:
clf;
x = repmat(1:10,15,1)';
y = repmat(linspace(0,5,15),10,1);
z=sin(x).*cos(y);
sh=fanplot(x, y, z);
Figure 1. Simple fanplot
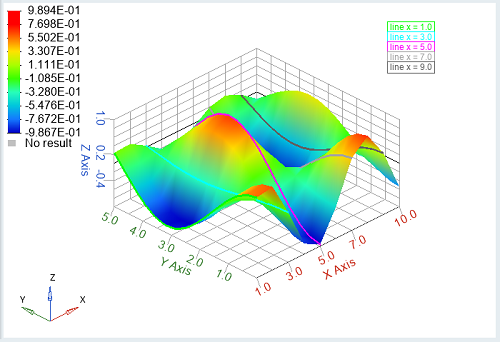
fanplot with selected curves
displayed:
clf;
x = repmat(1:10,15,1)';
y = repmat(linspace(0,5,15),10,1);
z=sin(x).*cos(y);
[sh lh th]=fanplot(x, y, z,'curves',[1:2:10],'text',{'line x = 1.0','line x = 3.0', 'line x = 5.0', 'line x = 7.0','line x = 9.0'});
Figure 2. fanplot with 'curves' and 'text' properties set
Comments
If there are no axes, one is created first. Matrices x,
y, and z must have the same dimensions MxN, where M
is the number of curves and N is the number of points in each curve.