surf
Creates surfaces in an axes and returns handles of the surfaces.
Syntax
h = surf(x, y, z)
h = surf(z)
h = surf(..., property, value, ...)
h = surf(hAxes, ...)
Inputs
- x, y, z
- Range of the x, y, and z axes..
- property
- Properties that control the appearance or behavior of the graphics object.
- value
- Value of the properties.
- hAxes
- Axis handle. .
Outputs
- h
- Handle of the surface graphics object.
Example
Simple surf example:
clf;
x=[0:0.1:2*pi];
y=x;
z=sin(x')*cos(y);
s=surf(x, y, z);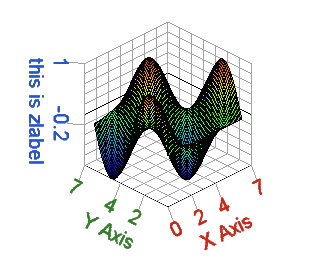
Figure 1. Surf plot
surf example with a handle as the first argument:
clf;
x=[0:0.1:2*pi];
y=x;
z=sin(x')*cos(y);
h = axes();
s=surf(h, x, y, z)
surf example setting a property:
clf;
x=[0:0.1:2*pi];
y=x;
z=sin(x')*cos(y);
s=surf(x, y, z, 'meshlines', 'off');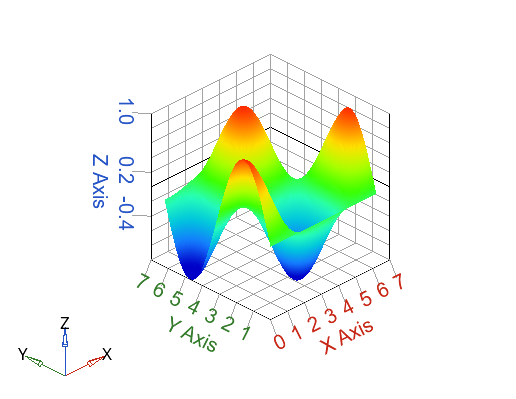
Figure 2. Surf plot with meshlines off
Set the color of the surface:
clf;
x=[0:0.1:2*pi];
y=x;
z=sin(x')*cos(y);
s=surf(x, y, z, 'color', 'r');
set(gca,'contourtype','none');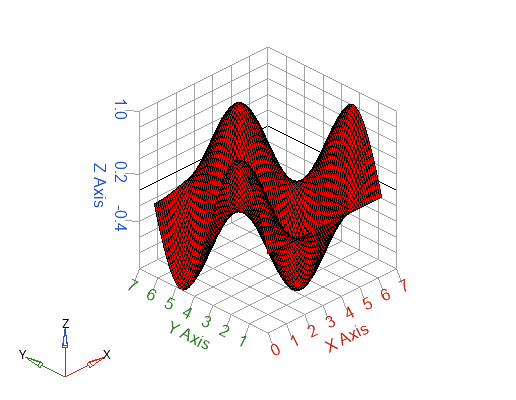
Figure 3. Surface color
Comments
If there is no axes, one will be created first. If x and y are omitted, the index of the columns of z is used for x coordinates and the index of the rows of z is used for y coordinates. surf takes optional arguments to control the surafce style. It can be either the color of the surface (not supported yet), or property/value pair(s), or both.
The 'contourtype' of an axes object that contains a surface is set to 'blended'.