Follow the order of these tasks to successfully import, visualize, and post-process
an XML model file using high frequency NVH and SEAM.
Start High Frequency NVH
From the menu bar, select the High Frequency NVH
profile.
Note: This option is only available if you have an
environment variable set.
Figure 1.
Import a Model
From the File > Import menu, select Import Third-Party XML.
From the XML Reader dialog, click the file
browser to select the XML file to import.
Figure 2.
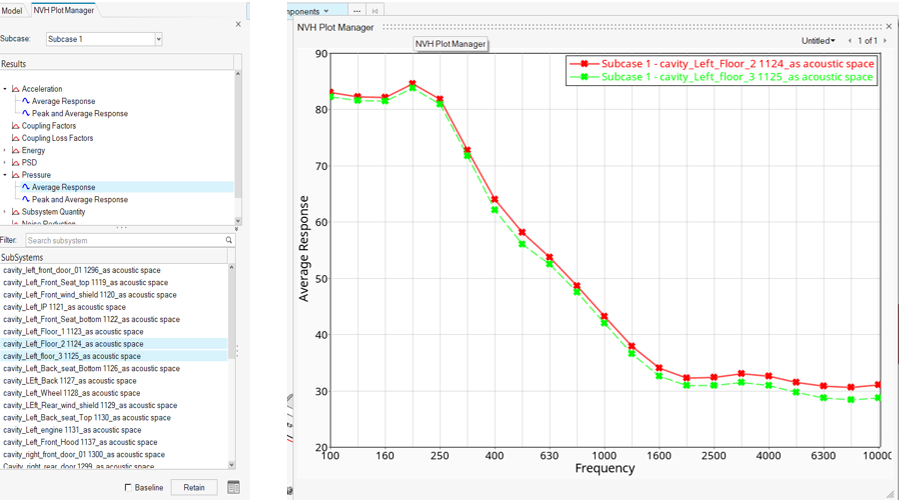
Visualize the Imported Model
After importing an XML file, visualize the
imported entities in the Model Browser and the graphical
user interface.
Figure 3. Figure 4.
Set the guide bar to SEA
Subsystems.
Figure 5. Figure 6. SEA Subsystems guide bar
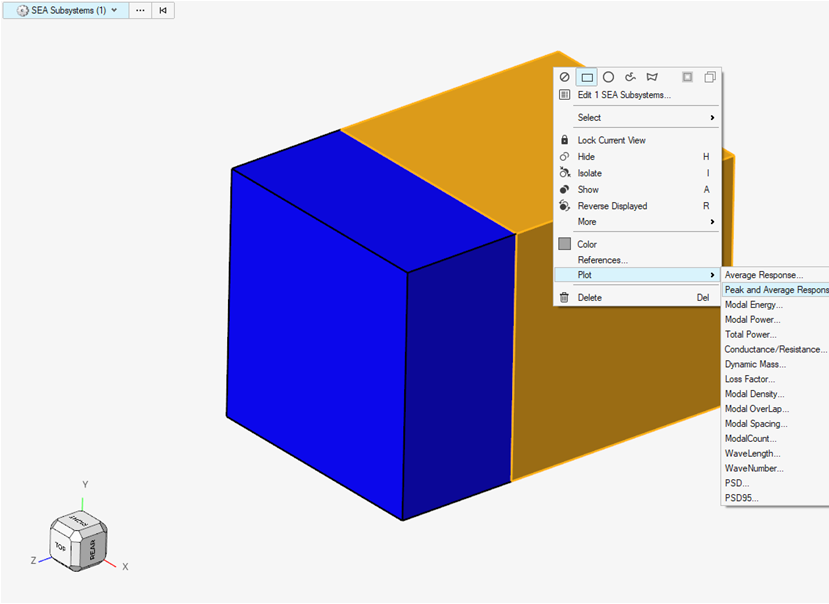
From the guide bar, right-click on a subsystem and
select Edit SEA Subsystems to visualize and edit the
subsystem parameters in the Entity Editor.
Figure 7. SEA Subsystems guide bar context menu
Parameter entities are populated based on the selected subsystems. From the
Entity Editor, select any SEA junction to isolate it
and view its properties. From the Model Browser,
double-click on a SEAM entity to open another
browser tab.
Figure 8. Edit Seasubsystems Entity Editor
Solve the Imported Files
Once the model is reviewed and verified, from the Analyse ribbon, Run tool
group, click the Generate and Run Seam Solver tool to
generate the SEAM Solver deck and solve the
model.
Figure 9.
SEAM subsystems entities are updated in the
Model Browser, based on the model content.
The generated solver file is solved in the background and the results are
populated in the session.
Once the calculation is complete, the following message is displayed:
Figure 10.
Solver files are generated in the following location on Windows:
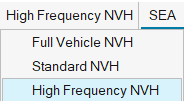
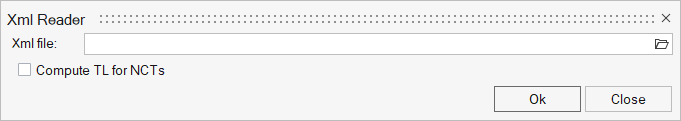
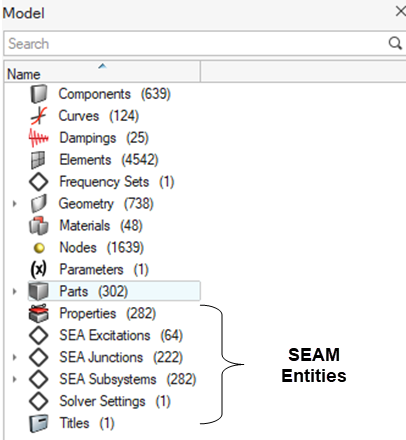
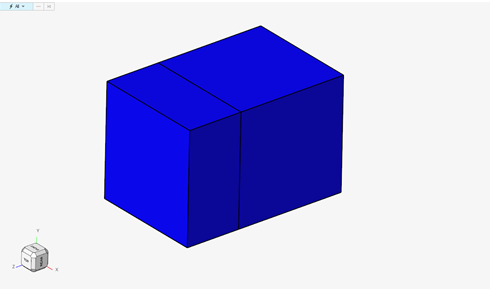
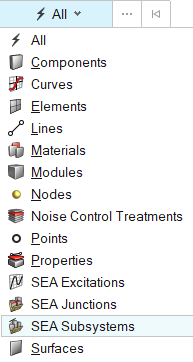
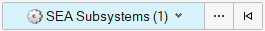
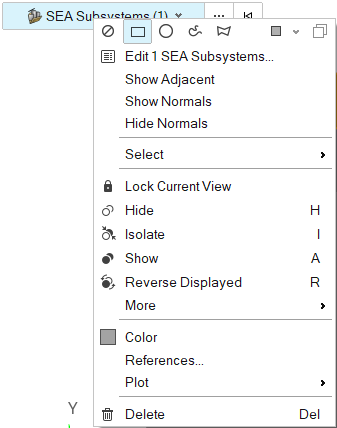
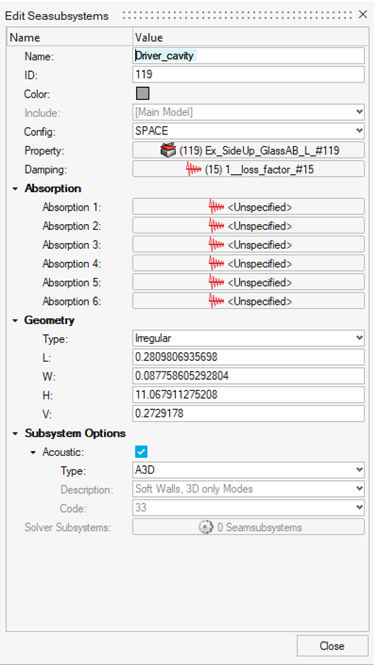

 Figure 10.