Visualize the relative effects that design variables and output responses have on DOE
explorations.
From the Design Explorer ribbon, Evaluate tool group, click the
Results Explorer tool.
The Results Explorer browser opens.
In the Results Explorer browser, click the Linear
Effects icon .
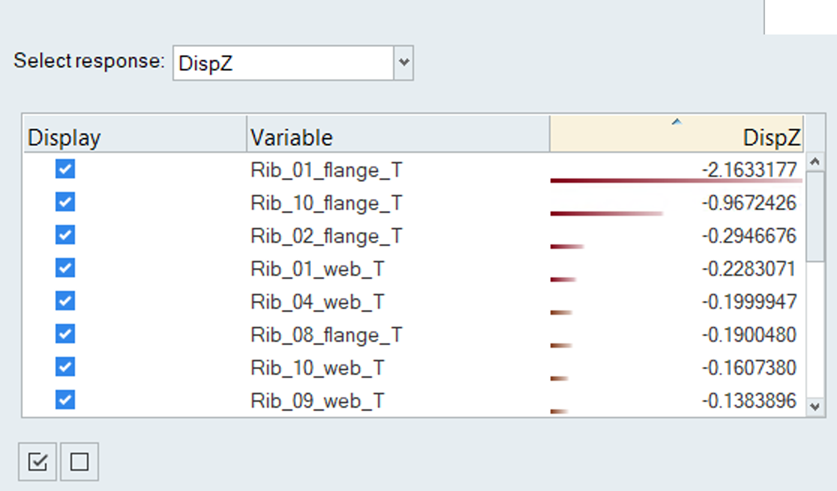
Select an output response from the Select response drop-down menu.
Visualize the results using the table and the modeling window.
The linear plot in the Results Explorer browser shows the
relative effect that a design variable has on the model for a selected response.
The larger the number, the larger the impact of the given variable, relative to
the other variables. The coloring of the effects indicates whether a given
effect has a positive or negative effect.
Positive effects are shown in shades of blue and indicate that a positive
change in the design variable results in a positive change on the response.
Negative effects are shown in shades of brown and indicate that a positive
change in the design variable results in a negative change on the response. For
example, an increase in the Rib_01_flange thickness variable is expected to
result in a significant decrease in the Z-displacement response, relative to all
other variables. Figure 1.
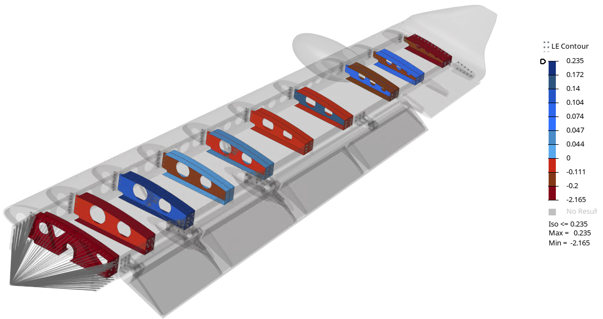
The contour plot and legend in the modeling window help you to further visualize the linear
effects.
Figure 2.
Select rows in the plot table to isolate and locate the given variable in the
model.

 .
.