stem3
Creates a 3D stem plot in an axis and returns the stem handle.
Syntax
h = stem3(x, y, z)
h = stem3(x, y, z, fmt)
h = stem3(z, fmt)
h = stem3(... property, value, ...)
h = stem3(hAxes, ...)
Inputs
- x,y,z
- Range of the x and y axes.
- fmt
- The formatting string for the curve. It can be any combination for the following
strings:
- line style: '-'.
- line color: 'r', 'g', 'b', 'c', 'y', 'm', 'w', 'b'.
- marker style: 's', 'o', 'd', 'x', 'v', '^', '+', '*', '.'.
- property
- Properties that control the appearance or behavior of the graphics object.
- value
- Value of the properties.
- hAxes
- Axis handle.
Outputs
- h
- The handle of the 3D stem graphics object.
Examples
Simple stem3 example:
clf;
h = stem3(1:10,rand(1,10),1:10);
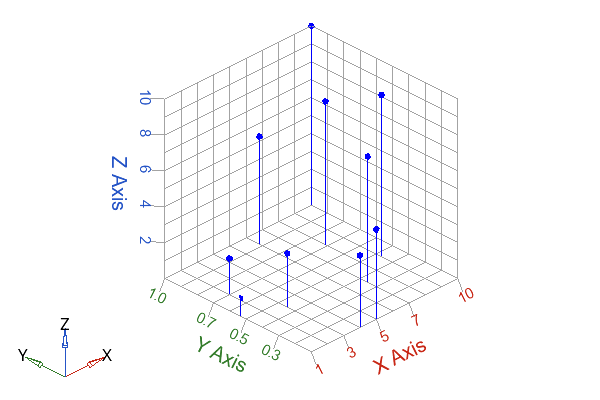
Figure 1. Stem3 example
stem3 example with format and property options:
clf;
h = stem3(1:10,rand(1,10),1:10,'^k','markersize',20);
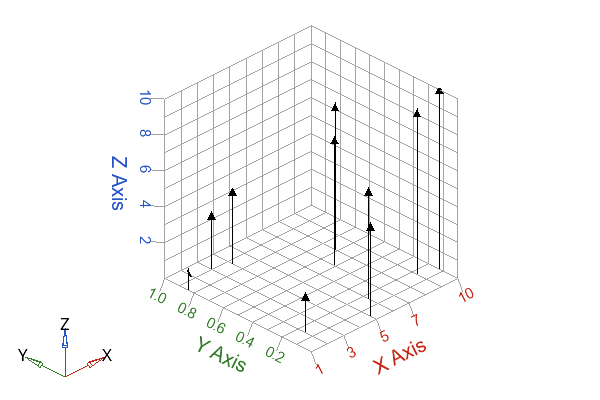
Figure 2. Stem3 with format and properties set
Single vector input example:
clf;
h = stem3(cos(1:0.2:10));
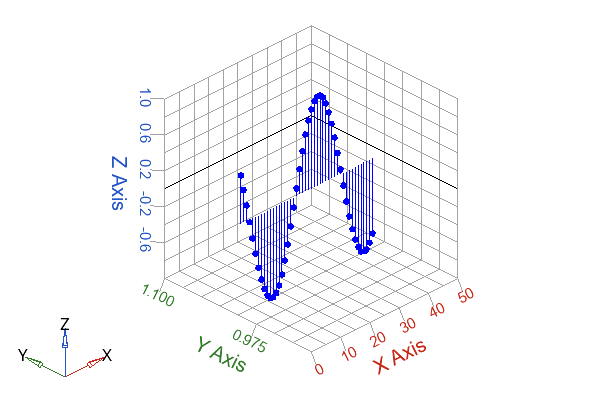
Figure 3. Stem3 - single vector input
Single matrix input example:
clf;
[x,y] = meshgrid(1:5);
z = abs(sin(x+y));
h = stem3(z,'marker','.');
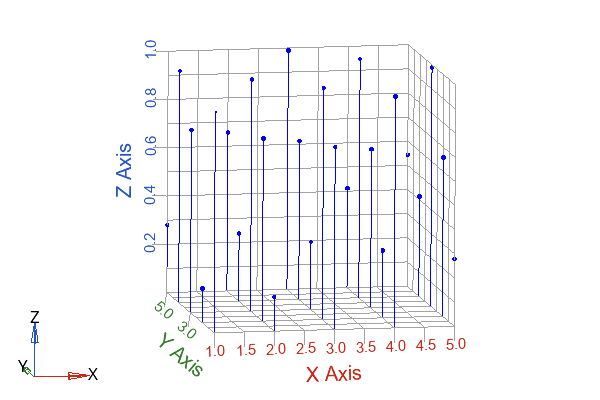
Figure 4. Stem3 - single matrix input
Comments
If there is no axis, one will be created first. If x and y are omitted, the index of z is used as data to associate with the the x and y axis. Stem3 takes optional arguments to control the stem style. It can be either a format string, property/value pair(s), or both. If the first argument of stem3() is an axis handle, the 3D stem will be created in that axis.