subplot
Sets up a plot grid with rows by cols subwindows and sets the current axes for plotting to the location given by index.
Syntax
subplot(rows, cols, index)
subplot(rcn)
Inputs
- rows, cols
- Any real number.
- index
- Index or vector of indices representing the location of the new plot in the grid.
- rcn
- 3-digit number with the first digit representing the number of rows, the second representings the number of columns, and the third representing the index.
Examples
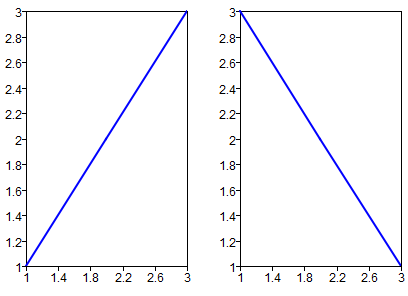
Simple subplot example:
clf;
subplot(1,2,1);
line([1 2 3], [1 2 3]);
subplot(1,2,2);
line([1 2 3], [3 2 1]);
Subplot expanding in two columns example:
clf;
subplot(2,2,1);
title('index = 1');
subplot(2,2,2);
title('index = 2');
subplot(2,2,3:4);
title('index = 3:4');
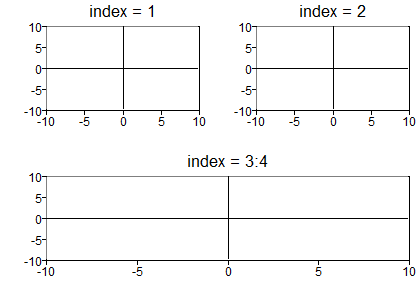
Figure 2. Sublot expanding in two columns
Subplot expanding in two rows example:
clf;
subplot(2,2,1);
title('index = 1');
subplot(2,2,3);
title('index = 3');
subplot(2,2,[2 4]);
title('index = [2 4]');
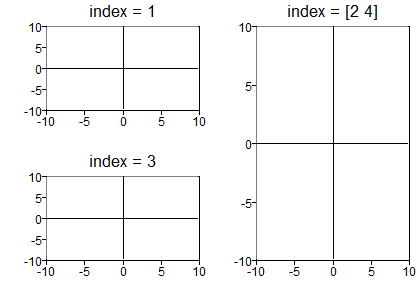
Figure 3. Sublot expanding in two rows
Subplot expanding in two rows (simplified syntax):
clf;
subplot(2,2,1);
title('(2,2,1)');
subplot(2,2,3);
title('(2,2,3)');
subplot(1,2,2);
title('(1,2,2)');
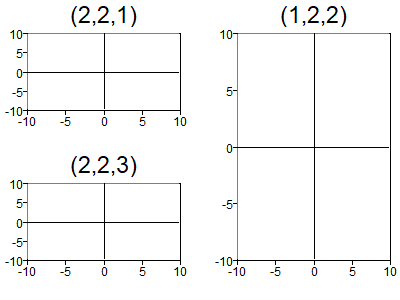
Figure 4. Sublot expanding in two rows
Comments
When one input is entered, it must be a 3-digit number. The first digit represents the number of rows, the second number represents the number of columns, and the third digit represents the index. If the position option is given with the pos variable, the resulting subplot will be precisely positioned at pos.