Using the Application Macro
Execute the application macro in POSTFEKO to plot S-parameter traces on a Cartesian graph.
The results from a single S-parameter configuration request will be provided as input to the macro.
-
Carry out the choices to set up the S-parameter graph.
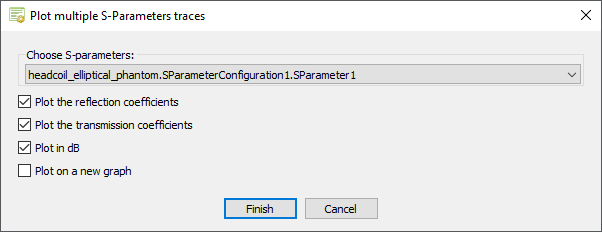
Figure 1. Dialog for selecting the result, quantities of interest and graph settings. -
If a new graph is selected, enter a name for the graph on the next dialog and
select Finish.
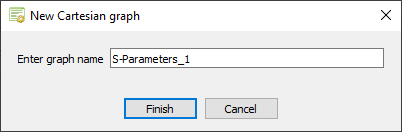
Figure 2. Dialog for entering the graph name. -
View the graph generated by the macro.
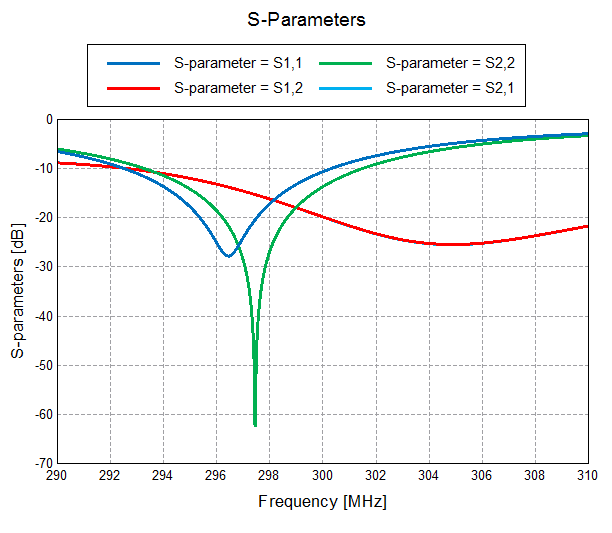
Figure 3. S-parameter graph with transmission and reflection coefficient magnitudes in dB for an MRI birdcage model.