Dam Break in 3D
Problem Description
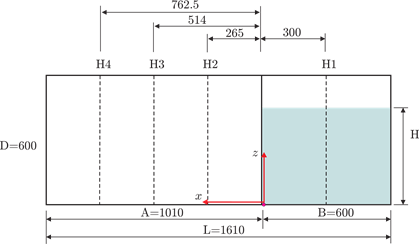
Figure 1. Sketch of Experimental Setup Taken from Lobovský et al (units in mm)
As shown above, the right part of the tank is filled with water (density: 997 kg/m3, kinematic viscosity: 8.9*10 -7 m2/s), with a height H of the water column. The experimental investigation comprise two different heights H = 300 mm and H = 600 mm, from which the former is simulated here. The setup is exposed to a gravity field with a constant acceleration of g = 9.81 m/s2 in negative z-direction. After the removal of the gate in positive z-direction, the water column collapses.
Numerical Setup
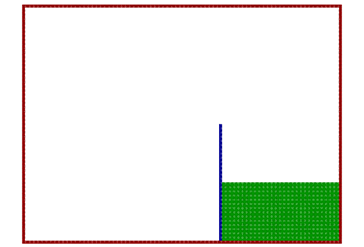
Figure 2.
Initially, the particles are distributed on an equidistant Cartesian grid with dx = 5e-3 m. As the air is assumed to have only a very limited influence on the collapse of the water column it is neglected in the conducted simulation. To prevent the water particles from flying away, the geometry of the tank is mirrored to the upper half to close the geometry. From the beginning of the simulation on, the gate (blue) is removed with the approximate velocity in the experimental investigations of 3.46 m/s as stated by Lobovský et al. The gate has to be chosen twice as thick as in the experiment as a representation by at least three particles is required for a wall boundary condition (see Adami et al).
Results
The temporal evolution of the water shape is shown in Table 1 in comparison to the snapshots of the experiment Lobovský et al at approximately corresponding times. The snapshots before the impact of the water lip show a qualitatively excellent agreement in the shape of the evolving water column. The splash after the impact seems to be over pronounced, although the assessment of the experimental snapshots in terms of the spray is difficult. A possible source of error in the simulation could be the neglect of the air.
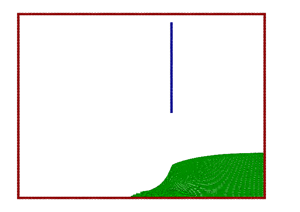 Figure 3. |
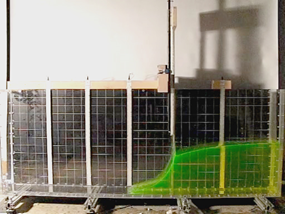 Figure 4. |
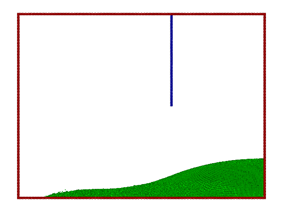 Figure 5. |
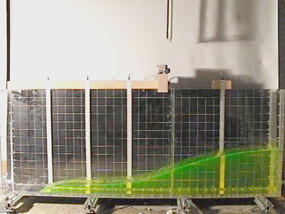 Figure 6. |
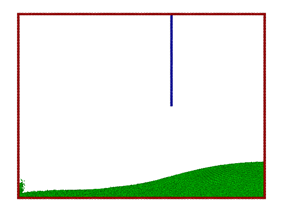 Figure 7. |
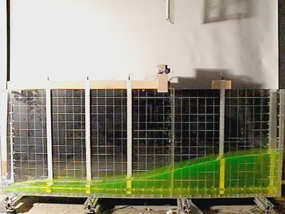 Figure 8. |
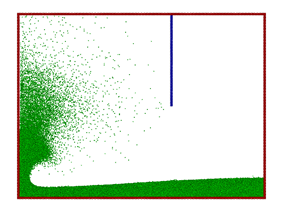 Figure 9. |
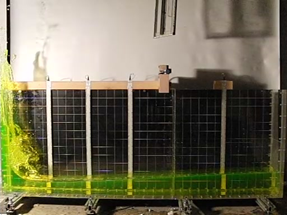 Figure 10. |
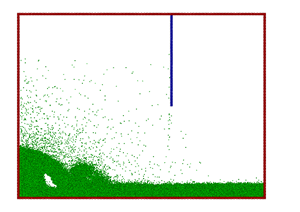 Figure 11. |
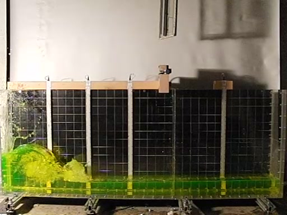 Figure 12. |
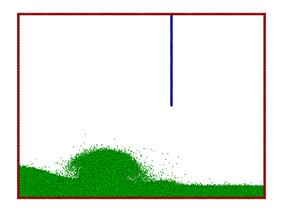 Figure 13. |
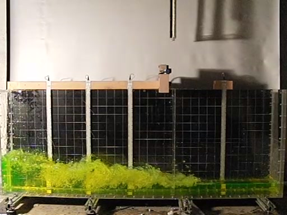 Figure 14. |
These differences could also be the reason for the discrepancies in the collapsing splash, giving a secondary splash in the simulation in contrast to the experiment. Further investigations including the effect of the air could possibly shed light on these effects.
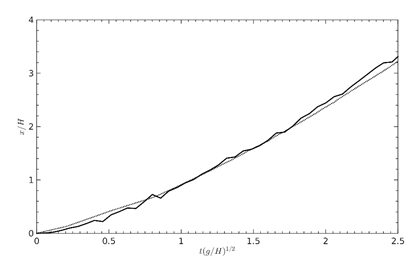
Figure 15. Temporal Evolution of the Front Lip in comparison to Lobovský et al
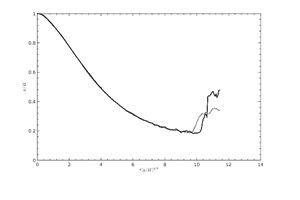 Figure 16. |
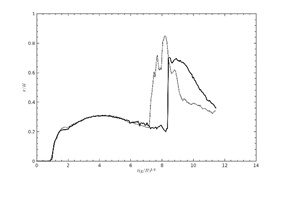 Figure 17. |
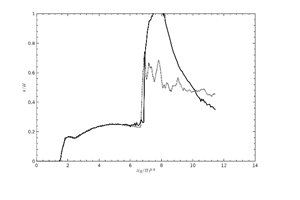 Figure 18. |
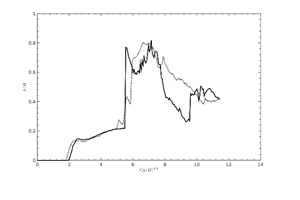 Figure 19. |
The rapid increase of the water level at the arrival of the backsplash is reproduced with varying discrepancies depending on the location, but still with reasonable agreement. The most pronounced difference at position H3 is obviously due to differences in the collapsing splash as already seen in Table 1.
L. Lobovský, E. Botia-Vera, F. Castellana, J. Mas-Soler and A. Souto-OIglesias, "Experimental investigation of dynamic pressure loads during dam break," Journal of Fluids and Structures, vol. 48, pp. 407-434, 2014.
S. Adami, H. Hu and N. Adams, "A generalized wall boundary condition for smoothed particle hydrodynamics," Journal of Computational Physics, vol. 231, pp. 7057-7075, 2012