Laplace’s law dictates the pressure difference between inside and the outside of a
bubble due to surface tension forces. The expression for a 2D problem
is:(1)
Where, is the surface tension coefficient and is the final radius of the bubble.
The expression for a 3D problem is:(2)
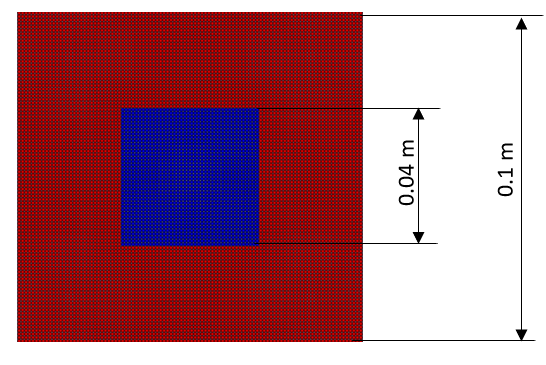
The initial particle arrangement for the 2D simulation as well as the problem
geometry are shown in Figure 1, where the bubble and bulk fluid are shown in blue and red,
respectively. For 3D simulation, the side lengths of the bubble fluid and bulk fluid
regions are the same as the 2D case. Figure 1. Initial Configuration of the 2D Laplace Law Problem. The blue particles are the bubble fluid phase, while the red is the bulk
fluid.
Numerical Setup
Here, a particle spacing of dx = 2*10-3 m is used for both 2D and 3D
cases. Both simulations run for five physical seconds. All boundaries are
periodic.
Results
The pressure inside the droplet is estimated by averaging values of all the particles
belonging to the droplet and comparing them to the average pressure outside of the
droplet. The estimated pressure difference for 2D and 3D cases and their comparison with the
analytic predictions are given in Table 1.
Table 1. Comparison of the Analytic Results Against the nanoFluidX
Relative error
2-Dimensional
0.452
0.443
2%
3-Dimensional
0.774
0.806
4%
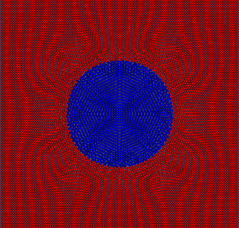
Figure 2 shows the final
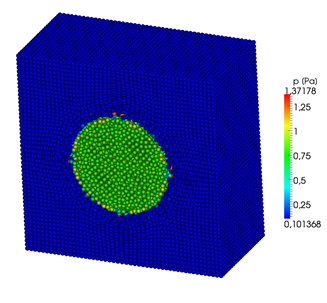
particle arrangement at t = 5 s for both cases. As expected, the bubble has reached
a circular shape in 2D and a spherical shape in 3D. Figure 2. Final Phase Configuration of the 2D Case at t = 5
s. The colors show bubble and bulk fluid phases. Figure 3. Final Phase Configuration of the 3D Case at t = 5
s. The colors show particle pressure.