HG-5010: Customize the Environment

In this tutorial, you will learn how to customize the program using the preference file.

The Preference File:

A preference file is a script file that is read each time the program is started. It specifies default user settings such as the order in which colors are assigned, the default printer, default page layout, the auto save interval, and so on. A standard preference file can be created in the program installation directory which is executed every time a license is activated. An additional preference file can be created in your working directory that contains personal settings that either overwrite the standard preference file or are added to the existing settings in the standard preference file.

The product installation contains two preference files located under $ALTAIR_HOME/hw:
  • All HyperWorks Desktop products, except HyperStudy: preferences.mvw
  • HyperStudy only: preferences_hst.mvw

Seven include preference files are contained in the installation. These include preference files must be included in the main preference file, as they cannot be used as independent preference files. They are located under $ALTAIR_HOME/hw/prefinc.

Organization of the Preference File:

The following describes the standard structure of the preferences file, containing five principal blocks.
*BeginDefaults()
*EndDefefaults()
*BeginDefinitions()
*EndDefinitions()
*BeginStatsTemplates()
*EndStatsTemplates()
*BeginPlotMacros()
*EndPlotMacros()
*BeginTemplexFunctions()
*EndTemplexFunctions() 

The *BeginDefaults() block is unique to a preference file while the *BeginDefintions(), *BeginStatsTemplates(), *BeginPlotMacros(), and *BeginTemplexFunctions() blocks are the same as those found in script files.

The following are general concepts for each of these sections:
*Id statement
The syntax for the *Id statement is: *Id("Release") where the release gives the program name and version.
For example: *Id("HyperGraph v8.0").
The *BeginDefaults - *EndDefaults block
The *BeginDefaults() block is comprised of general defaults and seven subordinate statement blocks. The general defaults are declared first, and then as many sub-blocks as required. Each sub-block has the same structure as the main block. This means there is a *Begin statement, followed by the necessary statements, and closing the block with an *End statement.
General defaults
General defaults include the autosave interval, bubble help status, and default printer settings. The block is delimited by these statements:
*BeginDefaults()
*EndDefaults()
Model defaults
Model defaults are used to customize the model tool bar and to add MDL defaults for submitting mechanical system models to a solver. The block is delimited by these statements:
*BeginModelDefaults()
*EndModelDefaults()
Graphic defaults
Graphic preferences such as model orientation and the part attributes are specified in the graphics default block. The block is delimited by these statements:
*BeginGraphicDefaults()
*EndGraphicDefaults()
Plot defaults
Plotting preferences for curves including colors, fonts, and note defaults are specified in the plotting defaults block. The block is delimited by these statements:
*BeginPlotDefaults()
*EndPlotDefaults()
TextEditor defaults
TextEditor preferences including text and background color and font settings are specified in the text editor defaults block. The block is delimited by these statements:
*BeginTextEditorDefaults()
*EndTextEditorDefaults()
Page header defaults
Page headers are specified in the page header block. The block is delimited by these statements:
*BeginHeader()
*EndHeader()
Page footer defaults
Page footers are specified in the page footer block. The block is delimited by these statements:
*BeginFooter()
*EndFooter()

To help you avoid compile problems, when you begin each block, start with the *Begin and *End block statements, then enter the remaining statements between the block delimiters.

Set the Auto Save Default

  1. Select TextView window mode.
  2. From the menu bar, select File > Open > Document and open the autosave_bubble_help.mvw file, located in the preferences folder.
  3. After the *BeginDefaults() line, add the following preference statement: *SetAutoSaveInterval(2)
    This sets the autosave interval to two minutes. If this statement does not appear in the preferences.mvw file, the program sets the autosave interval to 10 minutes.
  4. Save the new preference file to your home directory as new_autosave_bubble_help.mvw by selecting File > Save As > Document from the menu bar.

Observe the Updated AutoSave Default

  1. Start the program.
  2. Set the preference file by selecting File > Load > Preference File.
    This opens a window which lists all the registered preference files.
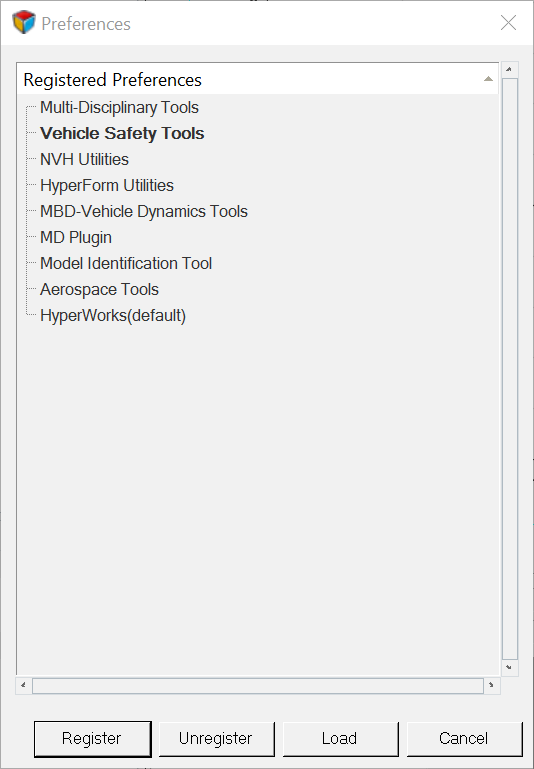
    Figure 1.
  3. Click Register and then browse for the file new_autosave_bubble_help.mvw.
  4. Select new_autosave_bubble_help.mvw from the list of Registered Preferences and then click Load to load the preference file.
    1. Click the red X in the upper right corner to close the window
  5. Wait for approximately two minutes and then list the contents of your working directory.
    A new file, autosave.mvw, will be present and contain a back up of the current session.

Set the Curve Defaults

  1. Open TextView from the client selector, .
  2. From the menu bar, select File > Open > Document and open the curve_defaults.mvw file, located in the preferences folder.
  3. After the *BeginPlotDefaults() line, add the *ResetCurveDefaults() statement to ignore all previous *SetCurveDefaults() statements.
  4. After the *ResetCurveDefaults() line, add the following preference statements to set the curve defaults:
    *SetCurveDefaults(1, 7, 0, 0, 0)	
    *SetCurveDefaults(3, 16, 1, 0, 0)
    *SetCurveDefaults(5, 24, 2, 0, 0)
    *SetCurveDefaults(2, 32, 3, 0, 0)
    *SetCurveDefaults(4, 40, 0, 0, 0)
    *SetCurveDefaults(5, 48, 1, 0, 0)

    A plotting preference block can contain several *SetCurveDefaults() statements. The program assigns curve attributes sequentially.

  5. Save the new preference file to your home directory as new_curve_defaults.mvw by selecting File > Save As > Document from the menu bar.

Observe the Updated Curve Default Settings

  1. Click Add Page, , to add a new page to the current session.
  2. Select HyperGraph 2D from the Select Application menu.
  3. Change the Page Window Layout to two windows per page, .
  4. Click Build Plots on the plotting toolbar.
  5. Open a plotting file:
    1. Click the file browser.
    2. Select the file ANGACC,located in the plotting folder.
    3. Click Open.
  6. Select the data components and channels to plot:
    1. Select Angular Acceleration from the Y Type list.
    2. Select 50th% Hybrid3 – LOWER TORSO from the Y Component list.
    3. Select the All button from the Y Channel list.
  7. Click Apply.
  8. Set the file new_curve_defaults.mvw as the preference file by selecting File > Load > Preference File.
  9. Select Register and then browse for the file new_curve_defaults.mvw.
    This automatically loads new_curve_defaults.mvw file as the preference file.
  10. Select new_curve_defaults.mvw from the list and click Load.
    1. Click the red X in the upper right corner to close the window.
  11. If prompted to “Update all plots current default colors”, select No.
  12. Click on the second plot window on this page.
  13. Click Build Plots from the plotting toolbar.
  14. Click Apply.
    The color and line styles follow the defaults defined in the new_curve_defaults.mvw file instead of the program system defaults.
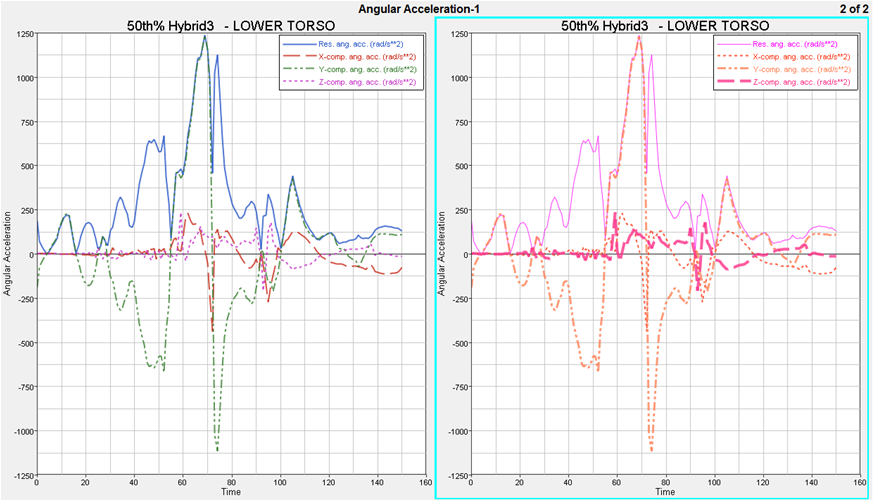
    Figure 2.

Set the Default Plot Colors

  1. Add a new page and select the TextView window mode.
  2. From the menu bar, select File > Open > Session and open the plot_colors.mvw file, located in the preferences folder.
  3. After the *BeginPlotDefaults() line, add the following preference statements to set the default plot colors:
    *SetBackgroundColor(9) 	
    *SetGridlineColor(6) 	
    *SetZerolineColor(2) 
    *SetFrameColor(7) 	 
    *SetAxisColor(4) 	
    *SetHeaderColor(0) 	
    *SetFooterColor(3)
  4. Save the new preference file as new_plot_colors.mvw in your working directory. You cannot save files back to the default directory.

Observe the Updated Default Plot Colors

  1. Click Add Page on the toolbar to add a new page to the current session.
  2. Select HyperGraph 2D from the Select Application menu.
  3. Create header and footer text.
  4. Register and Load the preference file new_plot_colors.mvw. If prompted to "Update all plots current default colors", click No.
  5. Add a new page, which will activate the new settings.
  6. Create header and footer text.
    Note: The colors of the various areas of the plot window reflect the defaults defined in the file new_plot_color.mvw rather than the program system defaults.

Set the Default Fonts for the Plot Area

  1. Add a new page and select the TextView window mode.
  2. From the file browser on the toolbar, open the file font_defaults.mvw, located in the preferences folder.
  3. After the *BeginPlotDefaults() line, add the following preference statements:
    *SetAxisLabelFont("Times New Roman", 1, 0, 8)
    *SetAxisTicFont("Times New Roman", 0, 1, 18)

    The first placeholder sets the font name.

    The second placeholder sets the font weight. 0 = normal (default), 1 = bold.

    The third placeholder sets the slant, or font style. 0 = normal (default), 1 = italic.

    The fourth placeholder sets the font size, 8, 10, 12, 14, 18, or 24 points.

    Note: If the suggested font is not available on your system, use the name of a font available on your system.
  4. After the *SetAxisTicFont() line, add the following preference statements to set the font defaults for the header and footer text:
    *SetLine1HeaderFont("Verdana",0,0,8)
    *SetLine2HeaderFont("Verdana",1,0,10)
    *SetLine3HeaderFont("Verdana",0,1,12)
    *SetLine1FooterFont("Tahoma",0,0,8)
    *SetLine2FooterFont("Tahoma",0,1,10)
    *SetLine3FooterFont("Tahoma",1,0,12)
    Note: If the suggested font is not available on your system, use the name of a font available on your system.
  5. Save the new preference file as new_font_defaults.mvw.

Observe the Updated Default Plot Fonts

  1. Click Add Page on the toolbar to add a new page to the current session.
  2. Select HyperGraph 2D from the Select Application menu.
  3. Create a three line header and footer on the plot.
  4. Register and Load the file new_font_defaults.mvw. If prompted to update to the current defaults, select No.
  5. Change Page Layout to two windows per page.
  6. Click on the second plot window on the current page.
  7. Create a three line header and footer on the plot.
    The fonts in the plot window reflect the defaults defined in the new_font_defaults.mvw file, including each line of the header and footer area, rather than the program system defaults.
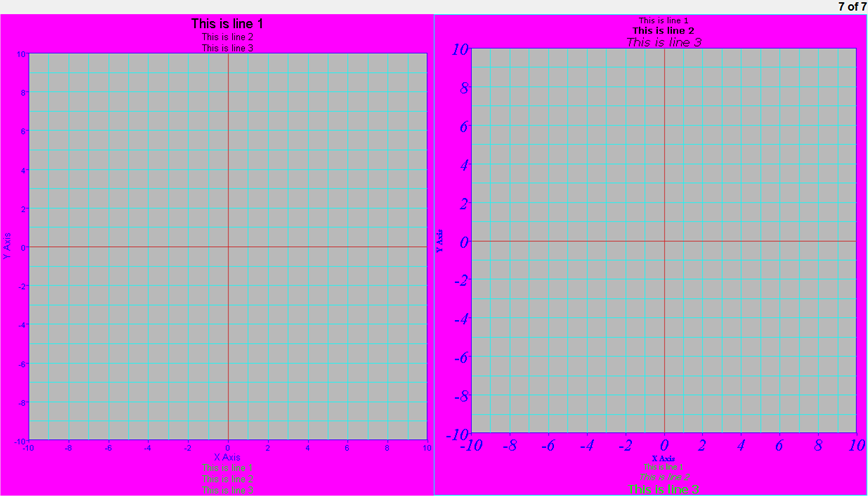
    Figure 3.

Set the Note Defaults

  1. Add a new page and select the TextView window mode.
  2. From the file browser on toolbar, select the file notes_legends.mvw, located in the preferences folder.
  3. After the *BeginPlotDefaults() line, add the following preference statement to set the default font type, style and size for notes:
    *SetNoteFont("Tahoma", 1, 1, 10)
  4. After the *SetNoteFont() line, add the following preference statements to set the default for note attachment, text alignment, and color:
    *SetNoteAttachment(View) 
    *SetNoteAlignment(Left) 
    *SetNoteColor(5) 
  5. Save the new preferences file as new_notes_legends.mvw.

Set the Legend Defaults

  1. Select the file new_notes_legends.mvw from the file browser in TextView window mode.
  2. After the *SetNoteColor() line, add the following preference statements to set the defaults for legend font and legend placement:
    *SetLegendFont("Tahoma",1,1,24)
    *SetLegendPlacement(TopRight)
  3. Save the new preference file as new_notes_legends.mvw.

Observe the Updated Default Plot Fonts

  1. Click Add Page on the toolbar to add a new page to the current session.
  2. Select HyperGraph 2D from the Select Application menu.
  3. Change page layout to two windows per page.
  4. Add a curve to the current plot.
  5. Add a note to the current plot.
  6. Register and Load the file new_notes_legends.mvw. If prompted to update to current defaults, select No.
  7. Click on the second plot window on the current page.
  8. Add a curve to the current plot.
  9. Add a note to the current plot.
    The note and legend displayed on the plot reflects the defaults defined in the new_notes_legends.mvw file. To view the note attachment update, translate the curves using the view control arrows located in the lower left of the program window.

Update Note and Legend Defaults

  1. Add a page and select TextView from the Select Application menu.
  2. From the file browser on the toolbar, open file headers_footers.mvw, located in the preferences folder.
  3. After the *BeginDefaults() line, add the following preference statements to define the *BeginHeader() block:
    *BeginHeader()
    *EndHeader()
  4. After the *BeginHeader() line, add the following preference statements to define portion of the available header area:
    *BeginRegion(400, 0, 600, 300)
    *EndRegion()
  5. Region descriptions use a coordinate system. The arguments in the region statement represent: the minimum X coordinate, the minimum Y coordinate, the maximum X coordinate and the maximum Y coordinate.
    If the region you were describing was the entire header area your *BeginRegion statement would be: *BeginRegion(0,0,1000,1000).
  6. After the *BeginRegion() line, add the following preference statements to set the text font, alignment and border for the region (update the path below to reflect where your installation is located):
    *Font("Times",0,1,12)
    *Alignment(Center)
    *BorderWidth(1,1,1,1)
  7. After the *BorderWidth() line, add the following preference statement to define the text in the header region:
    *Text("Project Title")
  8. Save the new preference file as new_headers_footers.mvw.

Add a Page Footer

  1. Your file should be new_headers_footers.mvw. If not, open the file new_headers_footers.mvw from TextView window mode.
  2. After the *EndHeader() line, add the following preference statements to define the *BeginFooter() block:
    *BeginFooter()
    *EndFooter()
  3. After the *BeginFooter() line, add the following preference statements to define and set up one region in the footer:
    *BeginRegion(700, 0, 1000, 1000)
    *Font("Times",0,1,12)
    *Alignment(Center)
    *BorderWidth(1,1,1,1)
    *EndRegion()

    The footer region’s coordinate system is similar to the header region: minimum X coordinate is 0 at the left and maximum X coordinate is 1000 at the right. The minimum Y coordinate is 0 at the base of the footer and its maximum coordinate is 1000.

  4. After the *BorderWidth() line, add the following preference statement to place text in the region:
    *Text("Your Name")
    *Text("{time()} on {date()}")
    *Text("Page:  {pagenum}/{numpages}")
  5. After the *EndRegion() line, add the following preference statements to define and set up a second region within the page footer:
    *BeginRegion(700, 0, 1000, 1000)
    *BorderWidth(1,1,1,1)
    *EndRegion()
  6. After the *BorderWidth() line, add the following preference statement to put an image in the region:
    *Image("<install_directory>/tutorials/mv_hv_hg/preferences/Altair_logo.gif")

    Images, such as company logos, can be added to any region within the header or footer of a plot. The image type must be either GIF (format 87), JPG or BMP. Images are fitted vertically and centered horizontally.

  7. Save the new preference file as new_headers_footers.mvw.

Observe the New Page Header and Footer

  1. Register and Load the preference file new_headers_footers.mvw.
  2. If a printer is installed, you can select Print and then click OK. These headers and footers will be seen when the session or page is printed.

Set the Text Editor Defaults

  1. Add a page and select TextView from the Select Application menu.
  2. From file browser on the toolbar, select the file text_editor.mvw, located in the preferences folder.
  3. After the *BeginTextEditorDefaults() line, add the following preference statement to set the default font type, style, and size for the text editor:
    *Font("Times", 0, 1, 12)
  4. After the *Font() line, add the following preference statement to set the default text color for the text editor window:
    *TextColor(6) 
  5. After the *TextColor() line, add the following preference statement to set the default background color for the text editor window:
    *BackGroundColor(23)
  6. Save the new preference file as new_text_editor.mvw.

Observe the Updated Default Plot Fonts

  1. Register and Load the file new_text_editor.mvw.
  2. Click the Add Page icon on the toolbar to add a new page to the current session.
    The updated default for the background color is displayed.
  3. Click in the text window and enter text to view changes to text defaults.