Gradient Post Processing
Visualize gradients using vectors.
Analyze Vector
Analyze the vector in a gradient plot from the Gradient tab. Representing gradients as a vector field is an effective way to see gradients in space.
-
Analyze the direction and intensity of the vector created using the selected
data sets.
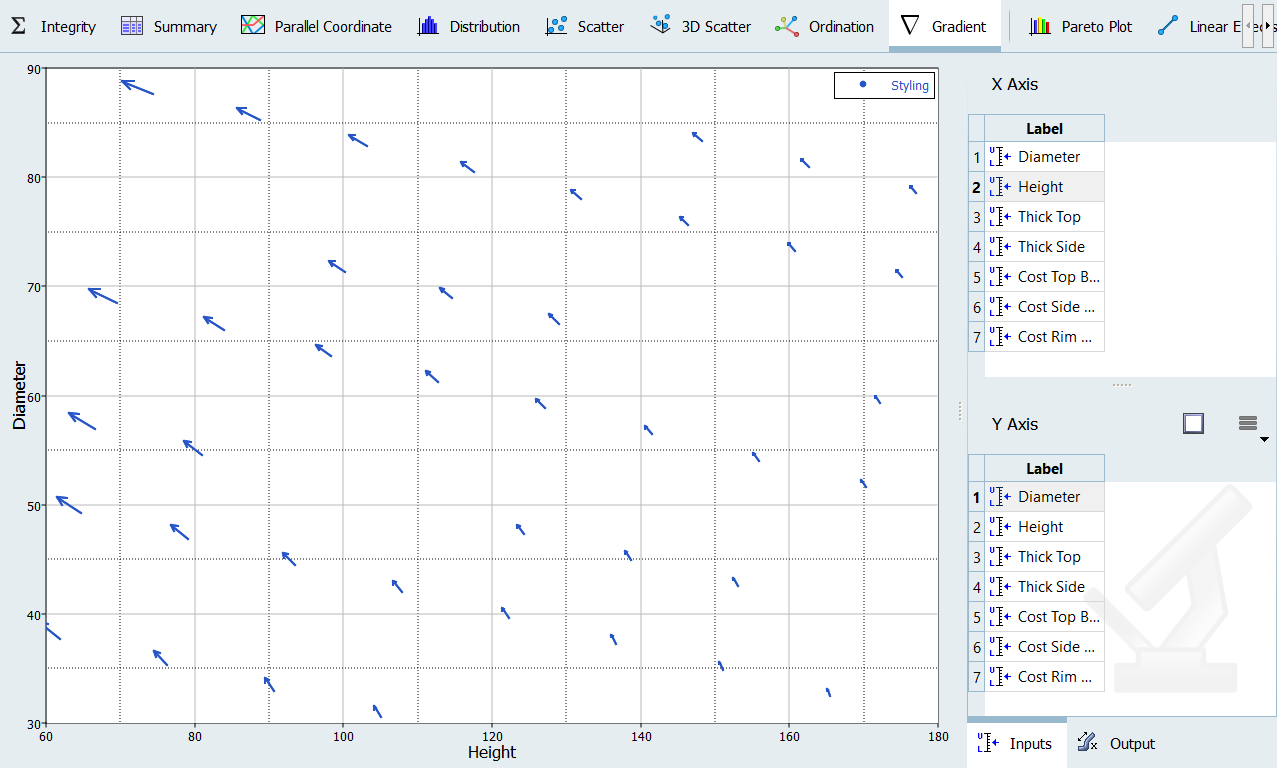
Figure 1.
Gradient Tab Settings
Settings to configure the plots displayed in the Gradient tab.
In the Gradient tab, use the Channel selector to select data to display in the gradient plot.
Channel Settings
- Inputs
- X-Bounds: display the X bounds in the plot.
- Output
- Gradient: display the vector in the plot.