Scatter 3D Post Processing
Analyze dependency between three sets of data.
Analyze Dependency Between Three Sets of Data
Analyze the dependency between three sets of data from a scatter plot in the Scatter 3D post processing tab.
-
Using the Channel selector, select three dimensions of data to plot.
Tip: For the Z-Axis, multiple input variables/output responses can be selected. Display selected data in a single plot or separate plots by switching the Multiplot option between
 (single plot) and
 (multiple
plots).
(multiple
plots).
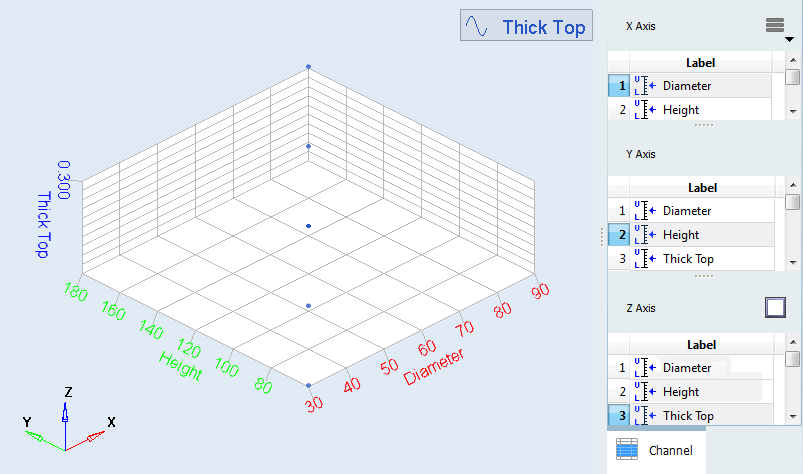
Figure 1.