HS-6000: Approximation on Arm Model
In this tutorial, you will learn how to create approximations for the output responses using Sampling Fit.
Before you begin, complete HS-2000: DOE Method Comparison: Arm Model Study
or import the HS-2000.hstx archive file, available at
<hst.zip>/HS-6000/.
Sampling Fit is a combination of space-filling DOE and Fit in a single approach.
HS-2000: DOE Method Comparison: Arm Model Study demonstrated studies can be conducted effectively with six input variables rather than nine because the other input variables did not have a great influence on the output responses. This will save computational effort.
Perform Sampling Fit Approach
-
Modify input variables.
-
In the work area, Active column, clear the
radius_1, radius_2,
and radius_3 checkboxes.
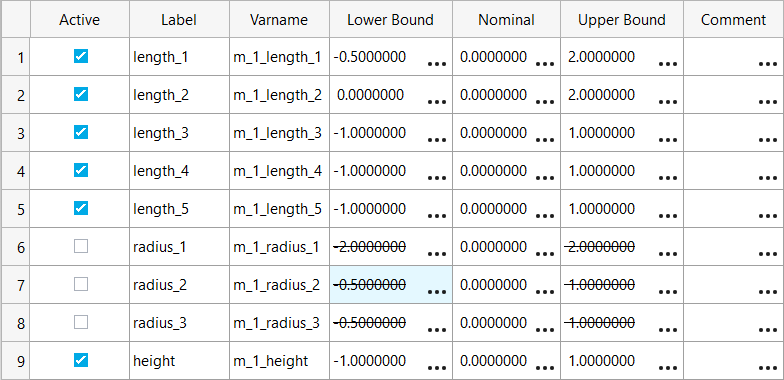
Figure 1.
-
In the work area, Active column, clear the
radius_1, radius_2,
and radius_3 checkboxes.
-
In the Fit Specifications tab, verify the Fit Type is set to
FAST for all responses.
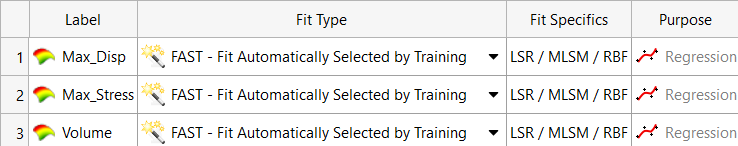
Figure 2. - Optional:
Monitor the trend of cross-validation and perform what-if scenarios while tasks
are being evaluated.
-
Go to the
R2Plot tab
to monitor cross-validation value per iteration.
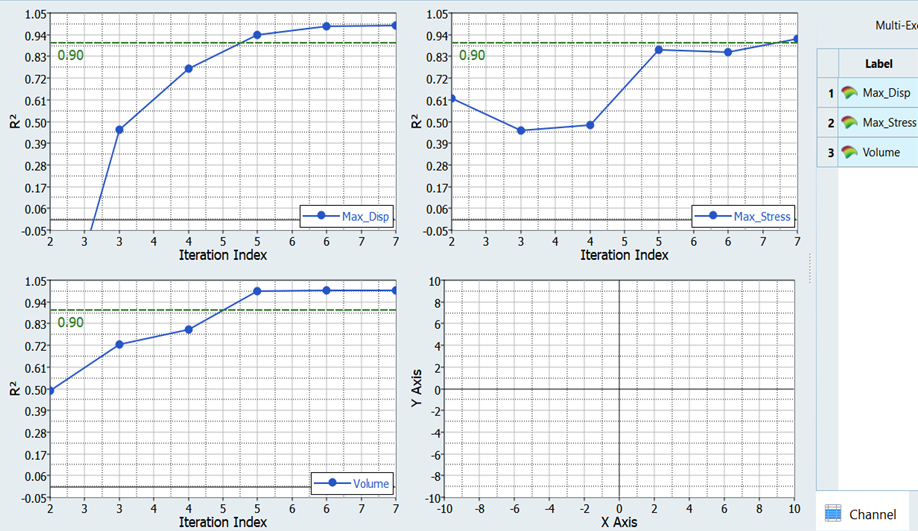
Figure 3. -
Go to the Trade-off tab to review what-if
scenarios.
Note: If there is a data point of interest, add it to the queue for evaluation.
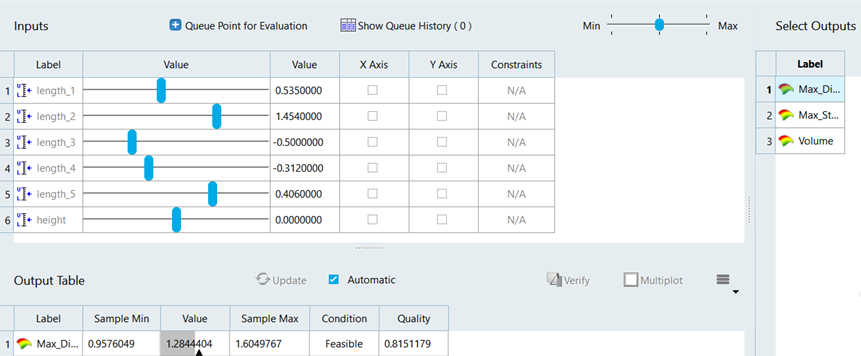
Figure 4.
-
Go to the
R2Plot tab
to monitor cross-validation value per iteration.
-
Go to the Post Processing step.
-
Go to the Diagnostics tab and click on each
label to review the detailed diagnostics of the fit model for each
response.
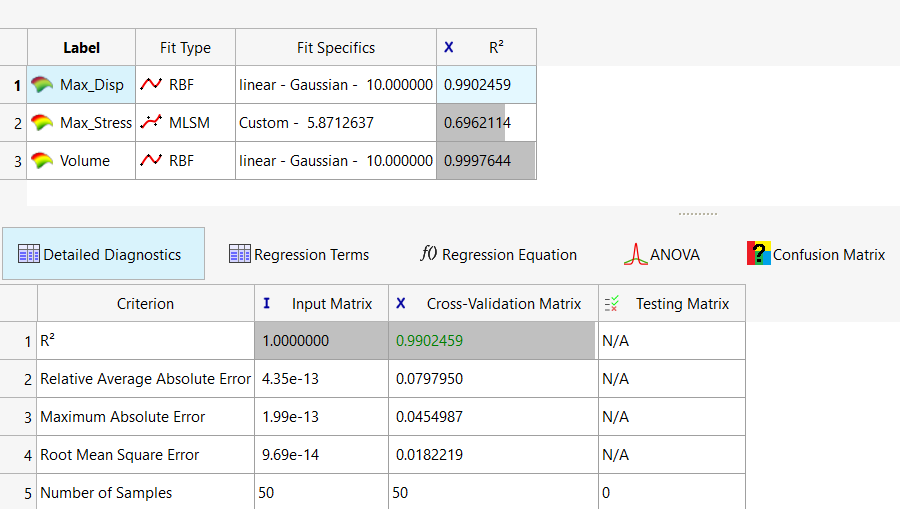
Figure 5. -
Go to the Residuals tab to review the error
between the original output response and the fit for each run of the
input and the cross-validation matrix.
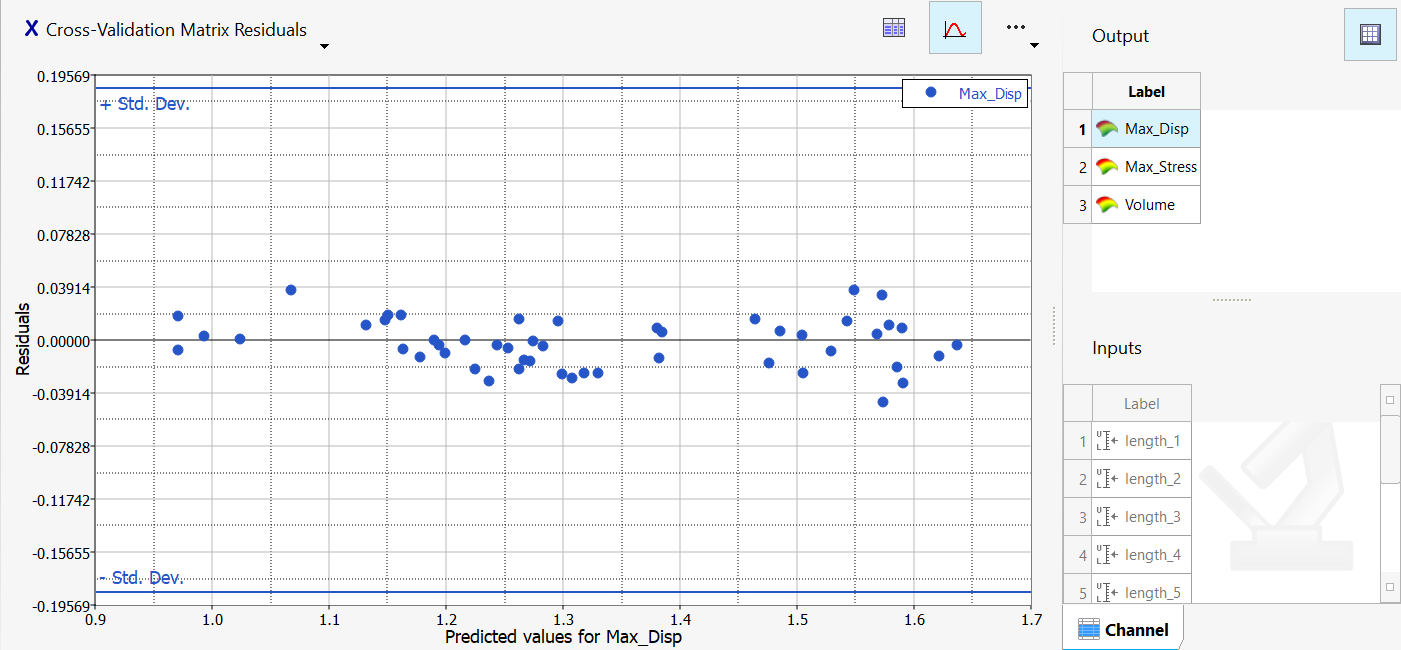
Figure 6.
-
Go to the Diagnostics tab and click on each
label to review the detailed diagnostics of the fit model for each
response.