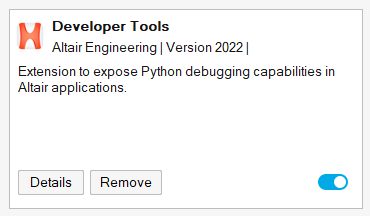
Developer Tools
Enable the Developer ribbon to access the Python Debugger.
-
In the Developer Tools extension, toggle
Load to expose the Developer
ribbon.
Python Debugger
Click the Debug icon to activate Debug mode.
-
On the Developer ribbon, select the Debug
tool.

-
From the Debug menu, select Start
Debugging, or click the Debug icon
 .
Note: The Python script in the Editor must be saved first. Unsaved file names are appended with *.Other windows become available under the Debug menu once Debugging Mode is activated.
.
Note: The Python script in the Editor must be saved first. Unsaved file names are appended with *.Other windows become available under the Debug menu once Debugging Mode is activated. -
Click Run File
 to start the debugging process.
Once a breakpoint is hit, an arrow is displayed inside of it. This indicates the next line of execution.
to start the debugging process.
Once a breakpoint is hit, an arrow is displayed inside of it. This indicates the next line of execution. -
Once a breakpoint is hit, select the next option:
- Click Step Over
 to execute the current line and move
over to execute the next one. The yellow arrow on the margin moves to that
point.
to execute the current line and move
over to execute the next one. The yellow arrow on the margin moves to that
point. - Click Step Into
 to enter any user written function
call at the current line of execution. If none exists, it behaves like
Step Over.
to enter any user written function
call at the current line of execution. If none exists, it behaves like
Step Over. - Conversely, click Step Out
 to come out of the current function
and to the point where the function was called.
to come out of the current function
and to the point where the function was called. - Click Step Until
 to resume execution until the next
breakpoint is hit in the remaining execution path or the end of script is
reached.
to resume execution until the next
breakpoint is hit in the remaining execution path or the end of script is
reached.
- Click Step Over
Model Window
The Model Window displays Inspire graphics changes as the code is executed.
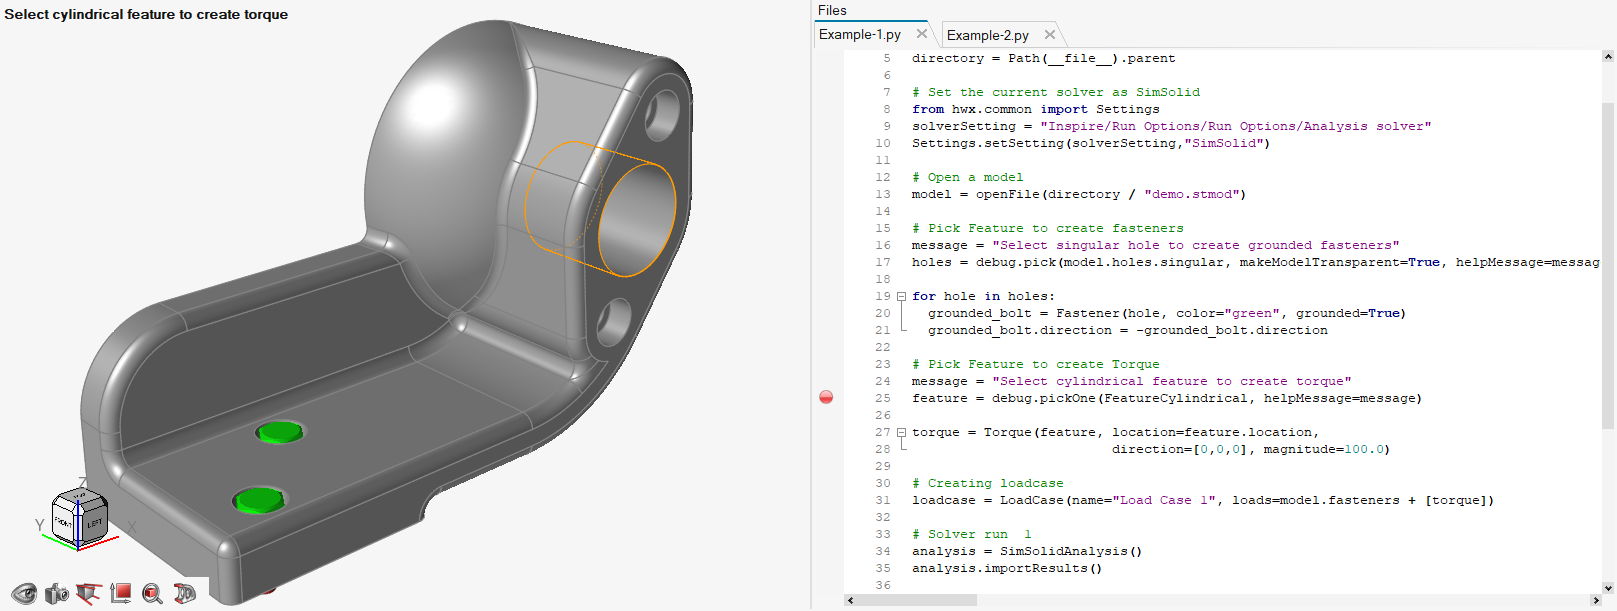 Figure 1. Prompt to select cylindrical feature to create torque
The components in the Model Window are transferred to Inspire on return.
The Inspire changes are retained on clicking the Inspire icon and returning to full Inspire mode.
Command History
The Command History displays a record of Python commands.
All commands that have been executed in the Python window are shown in order, with the last command at the top. Double-clicking a command calls the function again.
Python Variable Browser
Use the Python Variable Browser to monitor variable values while stepping through scripts.
By default, the Python Variable Window is not displayed. Use the View menu to show/hide the Python Variable Window.
Available variable names are listed, and the variable’s current value is displayed as well as its type and scope. The value can be overwritten by typing a new value. The changed value is used next.
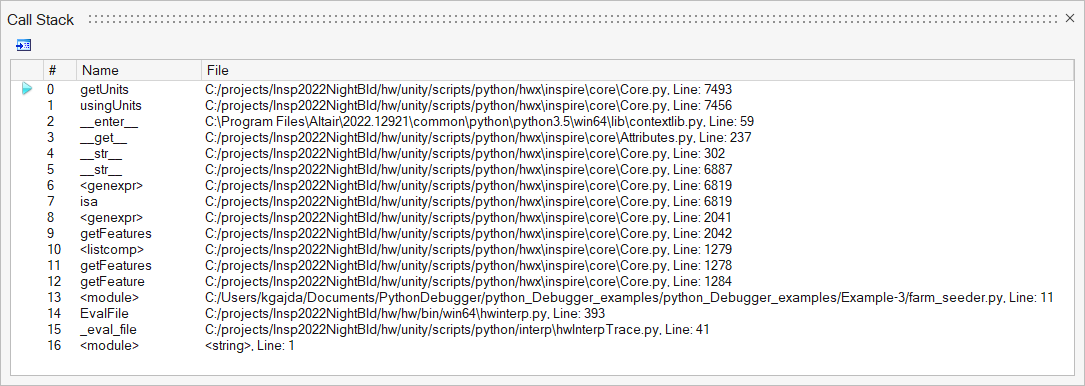
Call Stack Window
The Call Stack Window displays the paths traced while executing scripts.
The Call Stack Window is accessible only in debugging mode. And, by default, the Call Stack Window is not displayed. Use the to show/hide the Call Stack Window.
Watch Window
Use the Watch Window to monitor variable values while stepping through scripts.
The Watch Window is accessible only in debugging mode. And, by default, the Watch Window is not displayed. Use the menu to show/hide the Watch Window.
Variable names can be typed in the first column or can be dragged and placed there from the Editor. Alternatively, they can be added by highlighting them in the Editor and selecting the context menu option Add Selection to Watch. The variable’s current value (or values) is displayed in the second column. The value can be overwritten by typing a new value. The changed value is used next.
Breakpoints Window
The Breakpoints Window displays all breakpoints in the debugging session. Each breakpoint is listed along with its host file and the line number.
The Breakpoints Window is accessible only in debugging mode. And, by default, the Breakpoints Window is not displayed. Use the to show/hide the Breakpoints Window.
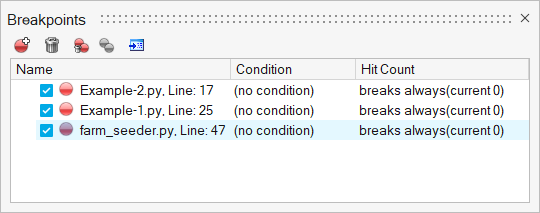
Individual breakpoints can be disabled by deactivating the box next to it. Breakpoints can also be created and deleted from this window. Clicking a breakpoint positions the cursor at that location in the Editor.
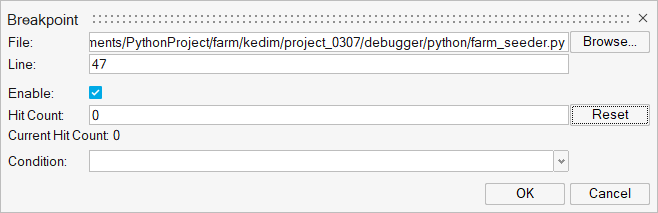 Figure 2. Edit Selected Breakpoint in Breakpoints Window
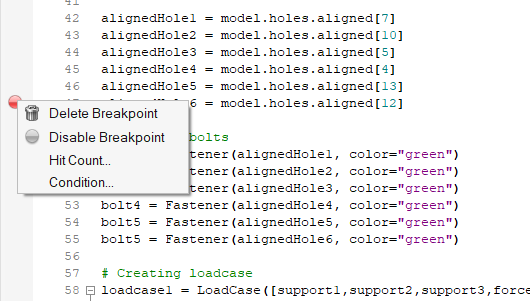 Figure 3. Adjusting a breakpoint in the Editor