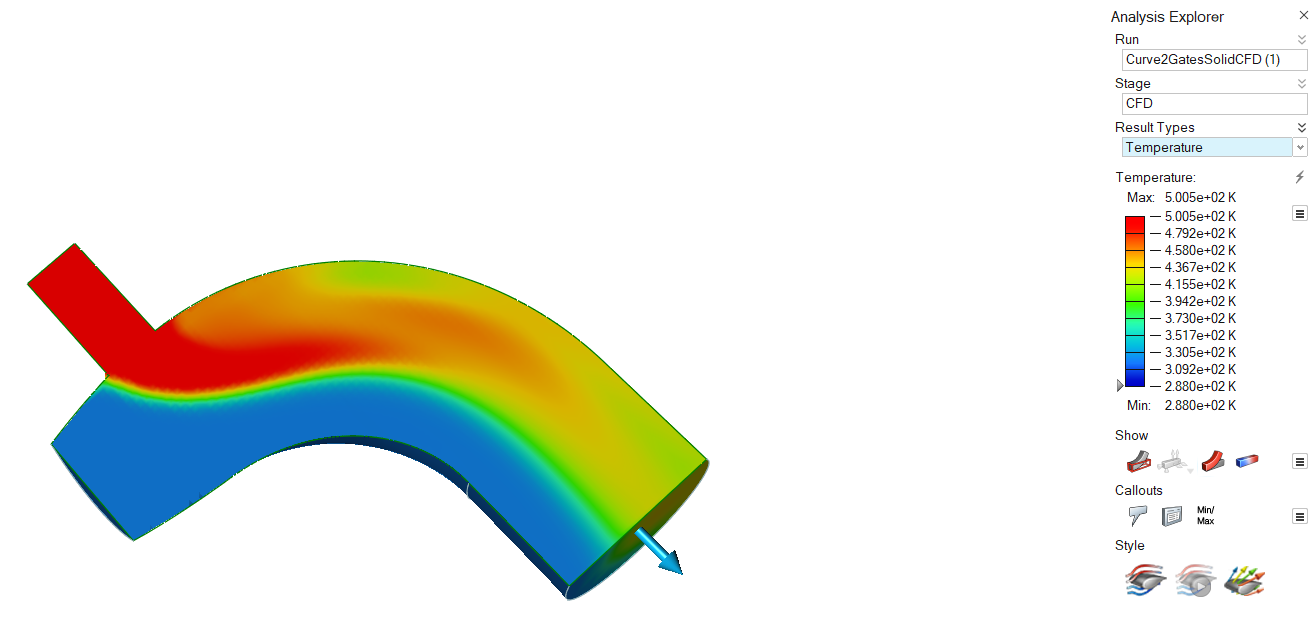
Show CFD Results
View the results of a CFD simulation in the Analysis Explorer.
Analysis Explorer Options
The Analysis Explorer includes the following options.
Run
To delete a run from the Analysis Explorer, right-click the run name to select Delete Run.
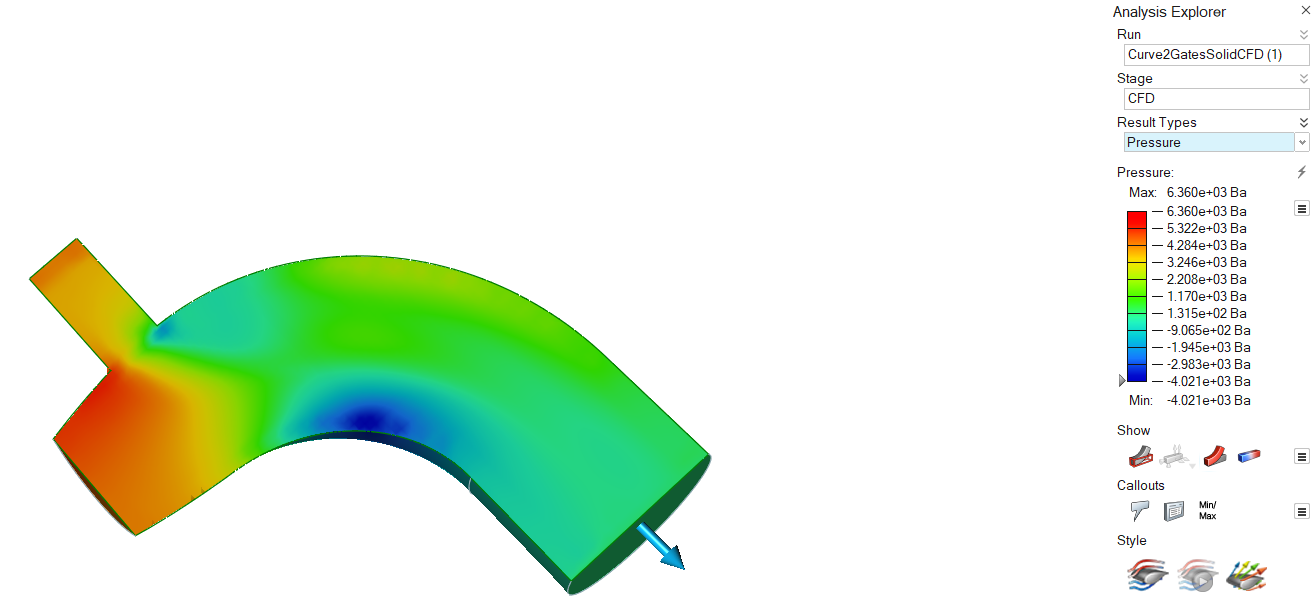
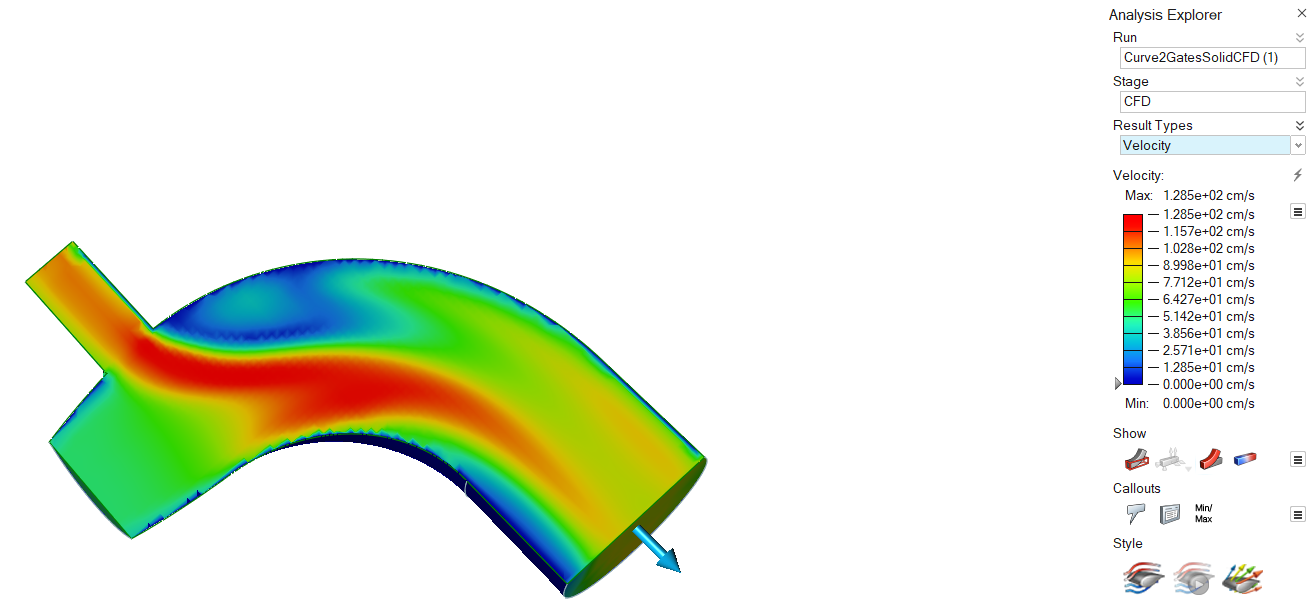
Result Types
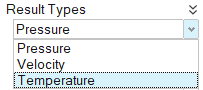
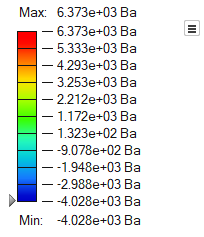
Pressure
Velocity
Temperature
Results Slider
- To change the upper or lower bound for the results slider, click on the bound and enter a new value. Click the reset button to restore the default values.
- To filter the results so that areas on the model with results greater than a
specified value are masked, click and drag the arrow on the results slider.
To mask areas with results less than the specified value, click
 and select Flip
Mask. Select the arrow to enter a specific value.
and select Flip
Mask. Select the arrow to enter a specific value. - To change the legend color for the result type, click the icon next to the results slider and
select Legend Colors.
Show/Hide Elements
When the Analysis Explorer is active, an additional Show/Hide
Elements
![]()
![]() icon appears under the view controls in the lower left
corner of the modeling window.
icon appears under the view controls in the lower left
corner of the modeling window.
Show Options
Determine what is made visible in the modeling window when viewing analysis results. You can show or hide the initial shape, loads and supports, deformation, and/or contours.
| Option | Description | Note | |
|---|---|---|---|
| Show/Hide Initial Shape | Show/hide the initial shape as a reference. | ||
| Show/Hide All Loads and Supports | Show/hide loads and supports. You can also show only the current loads and supports. | ||
| Show/Hide Deformed State | Show/hide the deformed shape as a reference. | ||
| Show/Hide Contours | Show/hide contours. | ||
| Options |
|
||
| Show/Hide Elements | Show/hide the element edges. | This icon appears under the view controls in the lower left of the modeling window, but only when the Analysis Explorer is active. | |
컬아웃 옵션
시각적 컬아웃을 추가하여 해석 결과에서 원하는 점을 표시합니다.
| 옵션 | 설명 | 참고 |
|---|---|---|
| 컬아웃 작성, 표시 및 숨기기 |
컬아웃을 작성하기 위해 선택합니다. 컬아웃을 표시하거나 숨기기 위해 선택합니다. |
|
| 컬아웃 목록 |
작성된 모든 컬아웃을 다양한 결과 유형 및 값과 함께 보여주는 표를 표시합니다. 각 컬아웃은 선택된 실행 및 로드 케이스.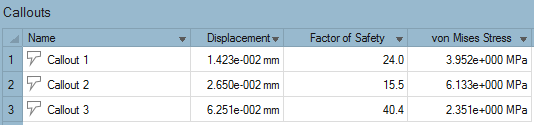 |
|
| 최소/최대 컬아웃 |
선택된 결과 유형에 대해 관련 최소값 또는 최대값이 발생하는 위치를 보여주는 컬아웃을 작성합니다. 주: 안전율이 선택된 경우, 최소값이 표시됩니다.
|
|
| 플롯 | 스트럭쳐 해석에 대해 정의된 컬아웃에 대한 타임 히스토리 플롯을 표시합니다. Result Types(결과 유형) 옵션에 대한 변경 사항은 Analysis Explorer(해석 탐색기)의 설정과 동기화됩니다. 이 옵션을 사용하면 혼합 유형의 여러 플롯을 단일 페이지에 배치할 수 있습니다. | 이 옵션은 모션 파트 해석 결과에만 사용할 수 있습니다. |
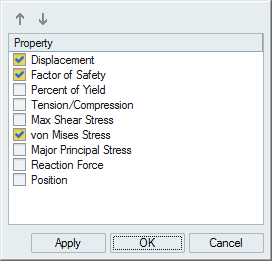
| 동적 컬아웃 |
기존 컬아웃에 다양한 유형의 결과를 표시합니다. 주: 컬아웃에서 결과 비교 기능을 사용하면 컬아웃이 고정됩니다.
|
특정 결과 유형에 대한 컬아웃을 작성한 후, |
Style Options
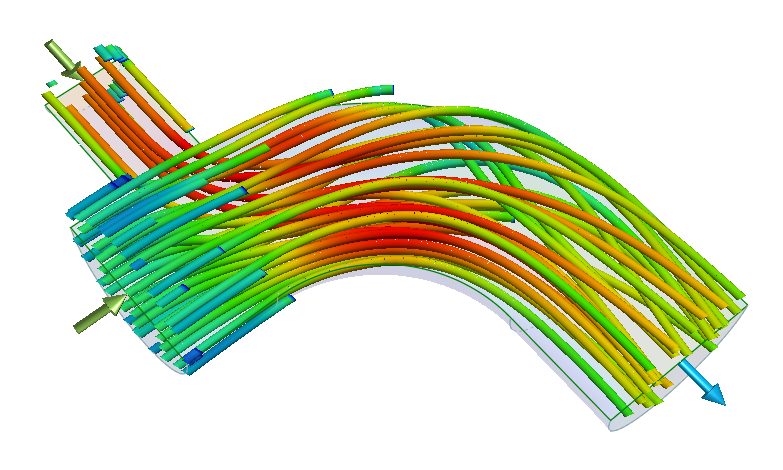
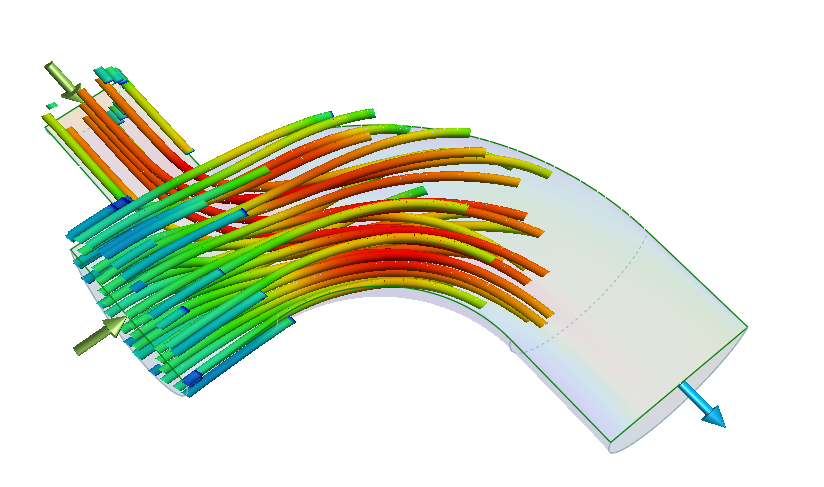
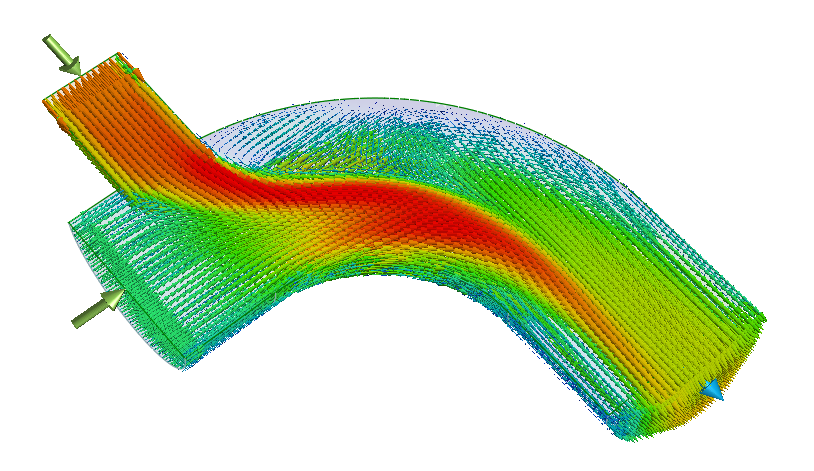
Visualize the results as static streamlines, animated streamlines, or vectors.
| Option | Description |
|---|---|
| Static Streamlines |
Visualize the results as static streamlines. In the microdialog, you
can adjust the following parameters:
 |
| Animated Streamlines |
Only available if Streamlines is turned
on. Click the icon once to visualize the results as animated
streamlines. Click the icon again to jump to the end of the
animation.
 |
| Vectors |
Visualize the results as vectors. In the microdialog, you can adjust
the following parameters:
 |