View Convergence Plot
Monitor the convergence of residuals during a CFD run.
-
While the simulation is running, on the Fluids ribbon, select the
View Convergence Plot tool in the Analyze
CFD tool group.

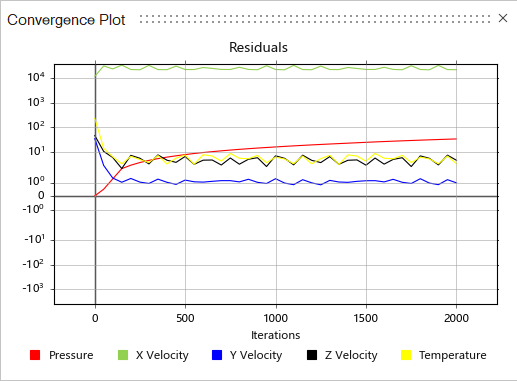
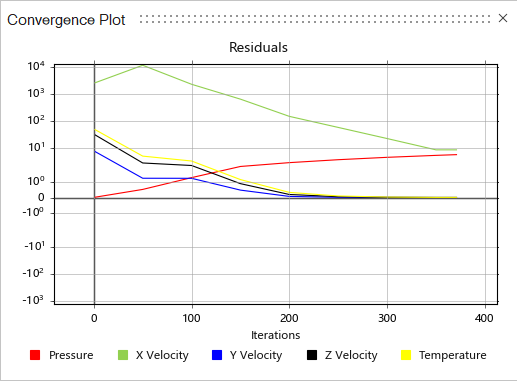
The convergence plot is displayed. By default, Numerical Convergence is displayed. The plot shows residual error vs. iteration for pressure; velocity in the x, y, and z directions; and temperature.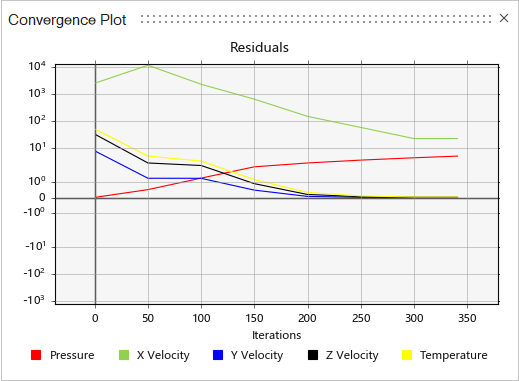
- When the curves converge to 0, you can stop the simulation in advance to review
the results.
- However, if the curves go up and down sharply, you need to correct the model
setup and run a new simulation to produce valid results.