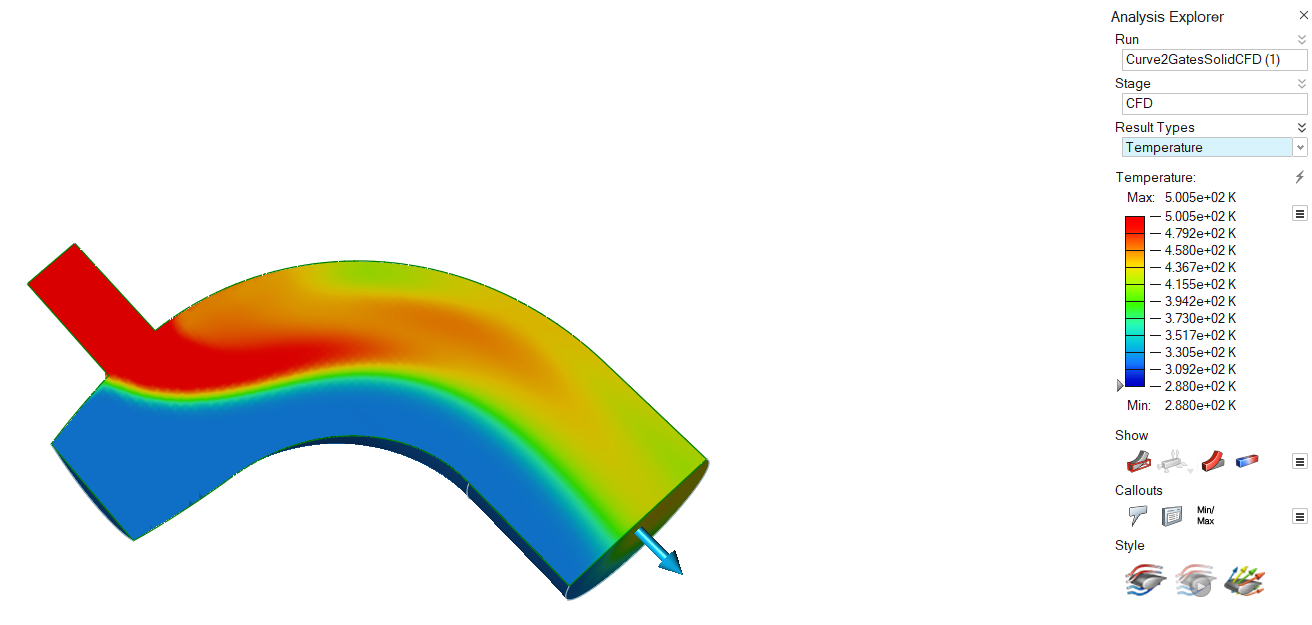
Show CFD Results
View the results of a CFD simulation in the Analysis Explorer.
Analysis Explorer Options
The Analysis Explorer includes the following options.
Run
To delete a run from the Analysis Explorer, right-click the run name to select Delete Run.
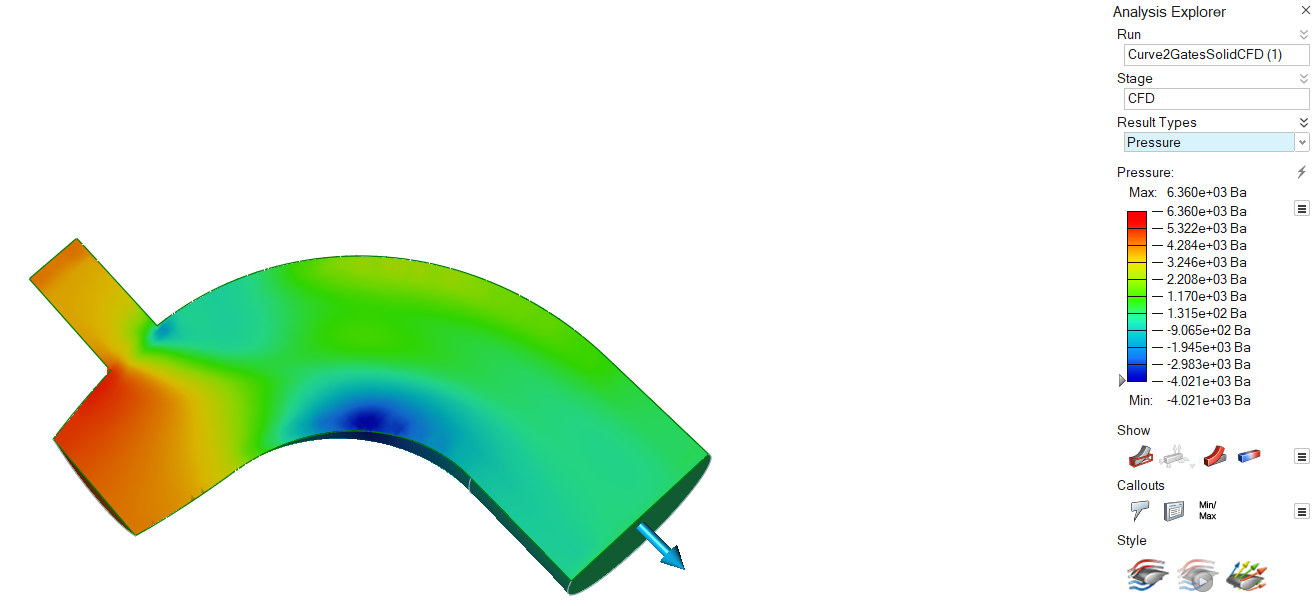
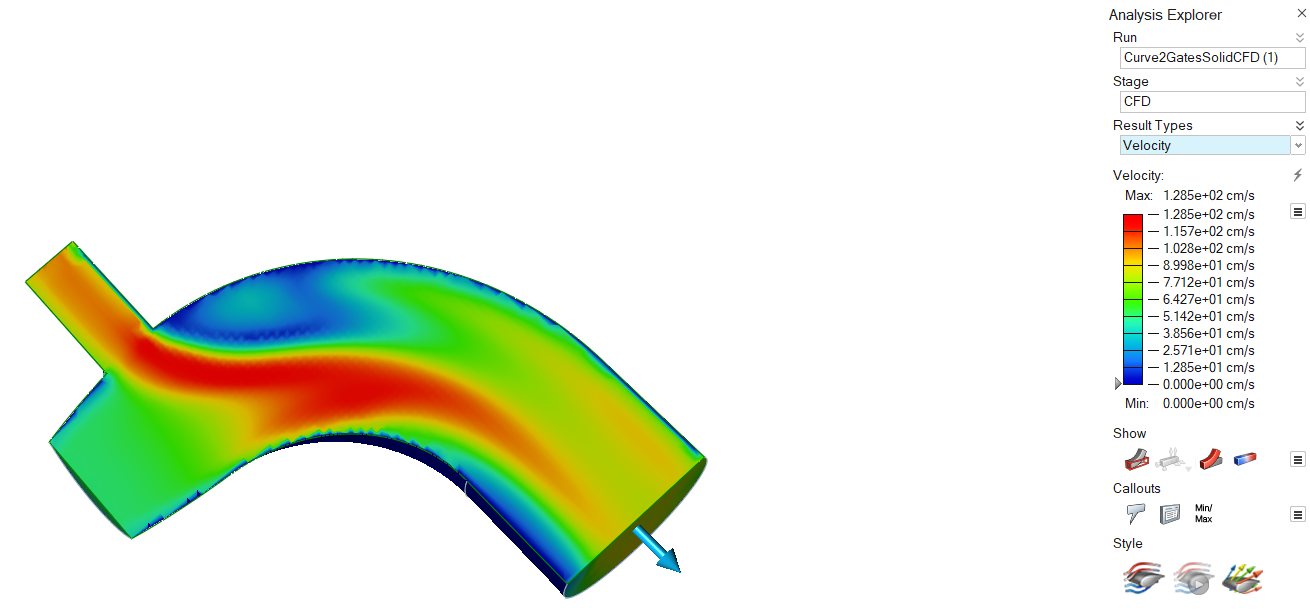
Result Types
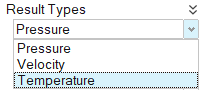
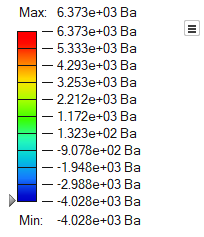
Pressure
Velocity
Temperature
Results Slider
- To change the upper or lower bound for the results slider, click on the bound and enter a new value. Click the reset button to restore the default values.
- To filter the results so that areas on the model with results greater than a
specified value are masked, click and drag the arrow on the results slider.
To mask areas with results less than the specified value, click
 and select Flip
Mask. Select the arrow to enter a specific value.
and select Flip
Mask. Select the arrow to enter a specific value. - To change the legend color for the result type, click the icon next to the results slider and
select Legend Colors.
Show/Hide Elements
When the Analysis Explorer is active, an additional Show/Hide
Elements
![]()
![]() icon appears under the view controls in the lower left
corner of the modeling window.
icon appears under the view controls in the lower left
corner of the modeling window.
Show Options
Determine what is made visible in the modeling window when viewing analysis results. You can show or hide the initial shape, loads and supports, deformation, and/or contours.
| Option | Description | Note | |
|---|---|---|---|
| Show/Hide Initial Shape | Show/hide the initial shape as a reference. | ||
| Show/Hide All Loads and Supports | Show/hide loads and supports. You can also show only the current loads and supports. | ||
| Show/Hide Deformed State | Show/hide the deformed shape as a reference. | ||
| Show/Hide Contours | Show/hide contours. | ||
| Options |
|
||
| Show/Hide Elements | Show/hide the element edges. | This icon appears under the view controls in the lower left of the modeling window, but only when the Analysis Explorer is active. | |
数据明细
添加视觉数据明细以在分析结果上显示的目标点。
| 选项 | 描述 | 注意 |
|---|---|---|
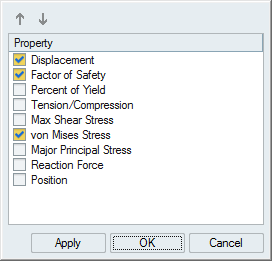
| 创建、显示和隐藏数据明细 |
选择创建数据明细;选择显示和隐藏数据明细。 |
|
| 列出数据明细 |
在表格显示已创建的所有数据明细,包括结果类型和值。每个数据明细都对应选中的运行和载荷工况。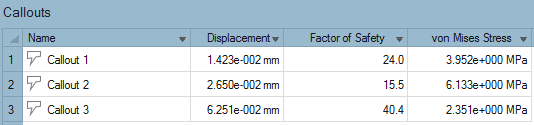 |
|
| 最小/最大数据明细 |
创建一个数据明细,显示所选结果类型的最小值/最大值的出现位置。 注: 选中安全系数后,即显示最小值。
|
|
| 绘制 | 显示为结构分析所定义的数据明细的时间关系图。对“结果类型”选项所做的更改将与“分析浏览器”上的设置同步。使用该选项可以将多个混合类型的图表放在一个页面上。 | 此选项仅可用于运动零件分析结果。 |
| 动态数据明细 |
显示现有数据明细中各种结果类型的结果。 注: 如果您在数据明细中启用了“对比结果”功能,则数据明细将变为静态。
|
创建了特定结果类型的数据明细后,点击 |
Style Options
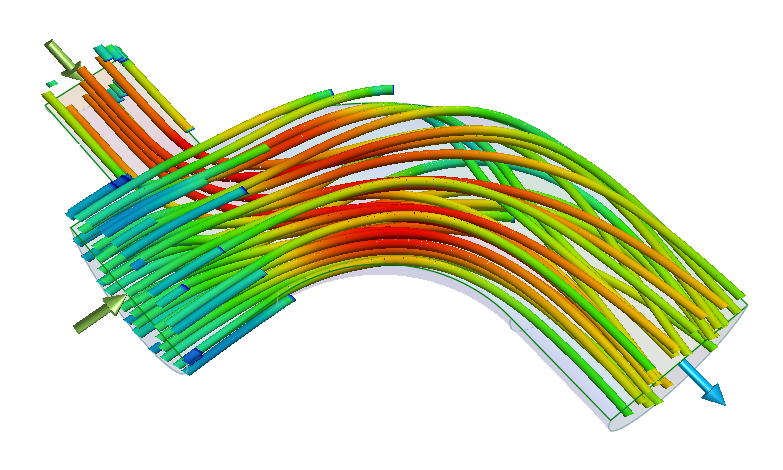
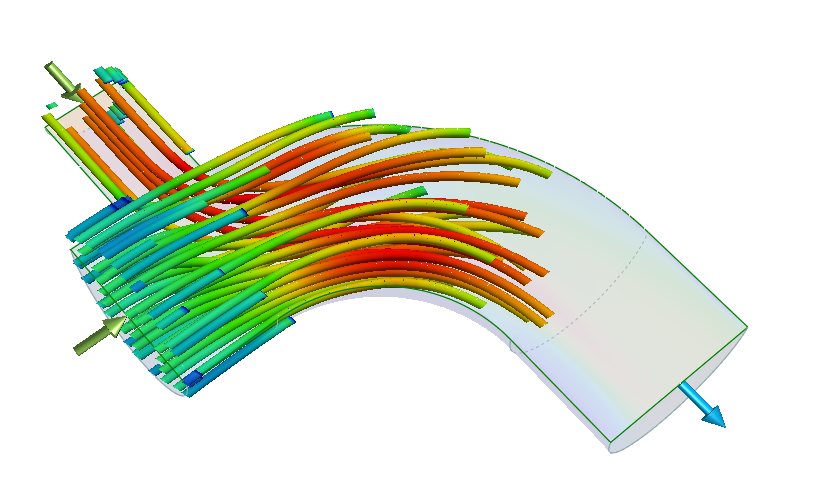
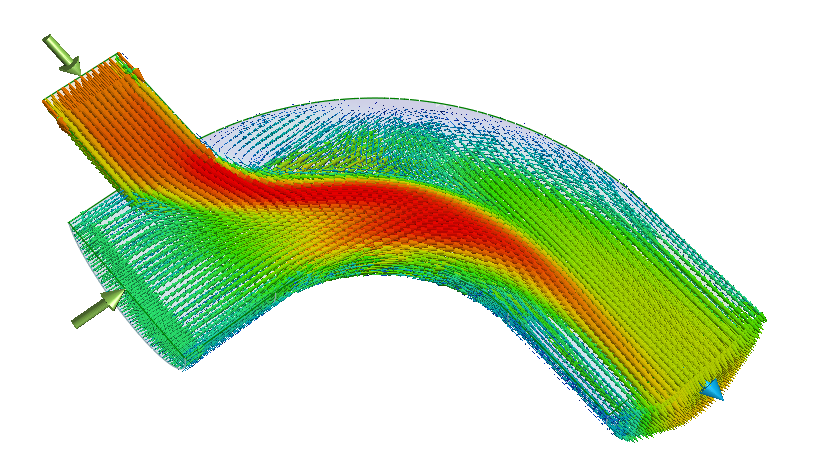
Visualize the results as static streamlines, animated streamlines, or vectors.
| Option | Description |
|---|---|
| Static Streamlines |
Visualize the results as static streamlines. In the microdialog, you
can adjust the following parameters:
 |
| Animated Streamlines |
Only available if Streamlines is turned
on. Click the icon once to visualize the results as animated
streamlines. Click the icon again to jump to the end of the
animation.
 |
| Vectors |
Visualize the results as vectors. In the microdialog, you can adjust
the following parameters:
 |