Near Field
Using this menu it is possible to analyze the amplitudes in the Near Field through the observation directions previously defined in the Output section.
The following options are available:
- View Cuts: display a plot that relates the amplitude against the observation cut.
- View Cuts by Frequency: displays a plot that relates the amplitude against a frequency sweep.
- View Cuts by Step: displays a plot that relates the amplitude against a parametric step.
- Near Field: displays the numeric results using a colored map.
- Delay Process: displays the results of the delay process.
- Power Process: displays the results of the power process.
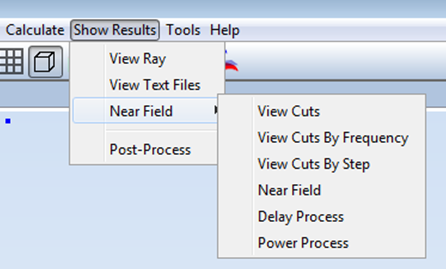
Figure 1. Show Results menu with a near field simulation