View Cuts by Frequency
This option is only enabled when a Frequency Sweep is chosen within the Simulation Parameters. It allows to compare the results in a given direction according to the frequency. When the user click on the View Cuts By Frequency option, the following panel will appear:
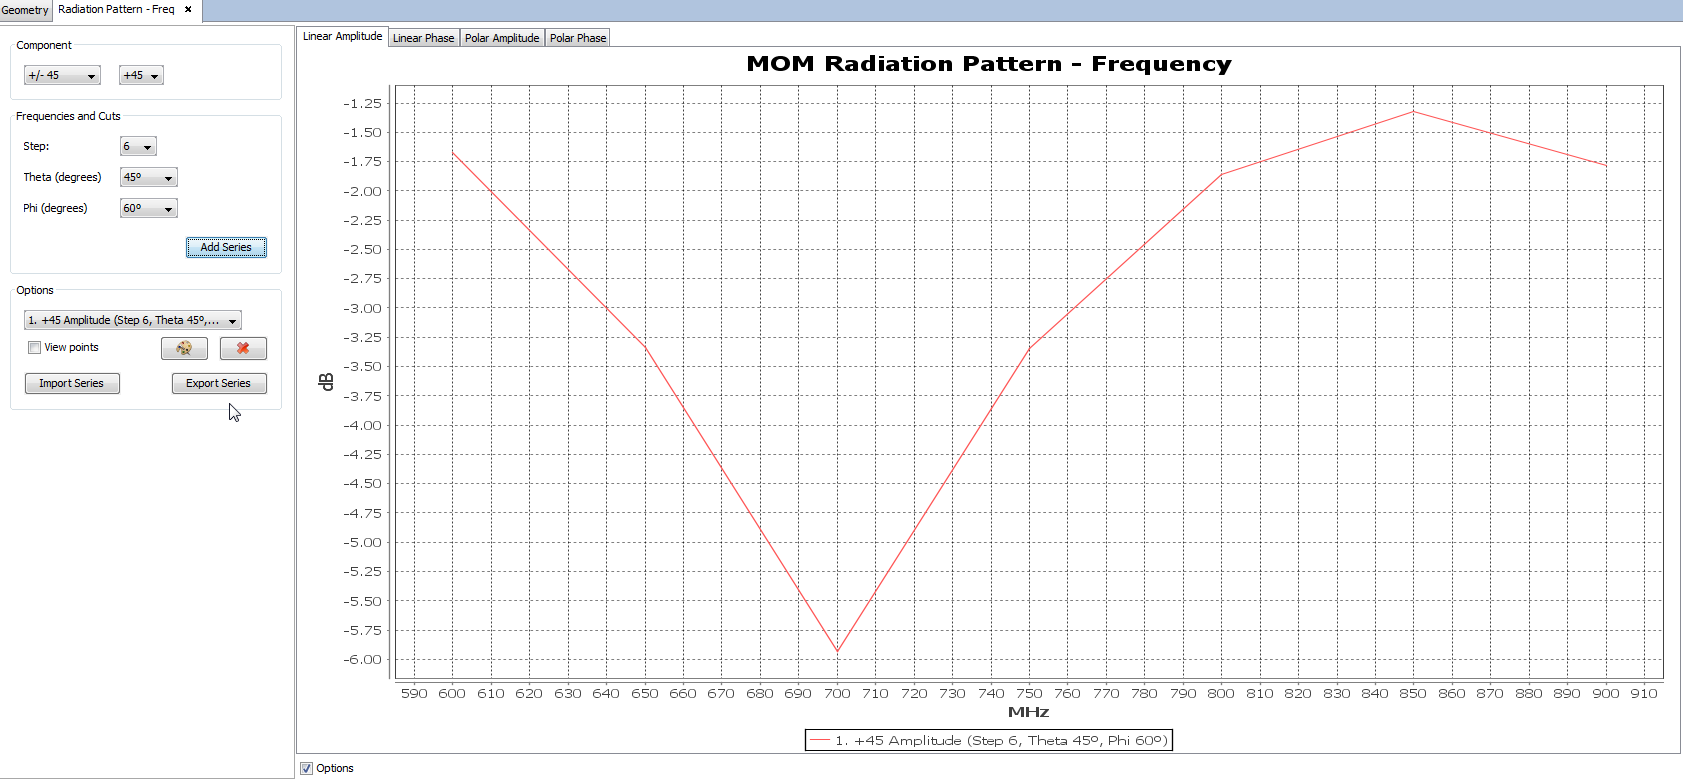
Figure 1. Radiation Pattern View Cuts panel by frequency. Linear Amplitude
This window plots both the amplitude and the phase of the FIELD or GAIN computed for every simulated frequency. It is specially useful when a Frequency Sweep is enabled, as we can compare the field values in each observation direction/point at every frequency. To plot a graph, select the desired observation points:
- Component The results may be plotted by using different polarizations and its components.
-
- Lineal: ETheta, EPhi, ETotal, Ex, Ey and Ex/Ey Total components.
- Circular RHCP, LHCP, Circular Total, and AxialRatio components.
- +/- 45 +45 and -45 components.
- 3rd Ludwig 3x Co-Polar, 3x Cross-Polar, 3y Co-Polar, and 3y Cross-Polar components.
- Gain (dBi): Theta Gain, Phi Gain, RHCP Gain, LHCP Gain and Total Gain components.
- Step and Spherical Coords the far field cuts are represented for each direction in the 3D Pattern.
-
- Step To select the geometric step in a parametric simulation. If the geometry does not contain any parameter, only one Step is available.
- Theta select the theta direction in the 3D pattern to compare its results according to the frequency.
- Phi select the phi direction in the 3D pattern to compare its results according to the frequency.
Then, click on Add Series button to plot the selected curve. Having inserted several plots, the Optionssection allow to edit the result curves:
- List of Series All the plotted polarizations and components are listed. Note that two options are included for every plot both the amplitude and the phase.
- View points Enable this option to visualize the points where the field has been computed for every inserted plot.
- Change color This option allows to change the color of the selected curve in the above List of Series.
- Remove To delete the selected curve in the above List of Series.
- Import Series To add a new plot from an external file. The file must have ". txt" extension, and it must contain in every new line the X and Y values to be plotted.
- Export Series:To export the selected curve in the above Plot List in a ".txt" file, with the X and Y values of the plot in a new line.
The user can also switch between the linear graph and the polar graph to visualize far field results. It is possible to visualize the Linear Phase, Polar Amplitude and Polar Phase by clicking on their respective tabs.
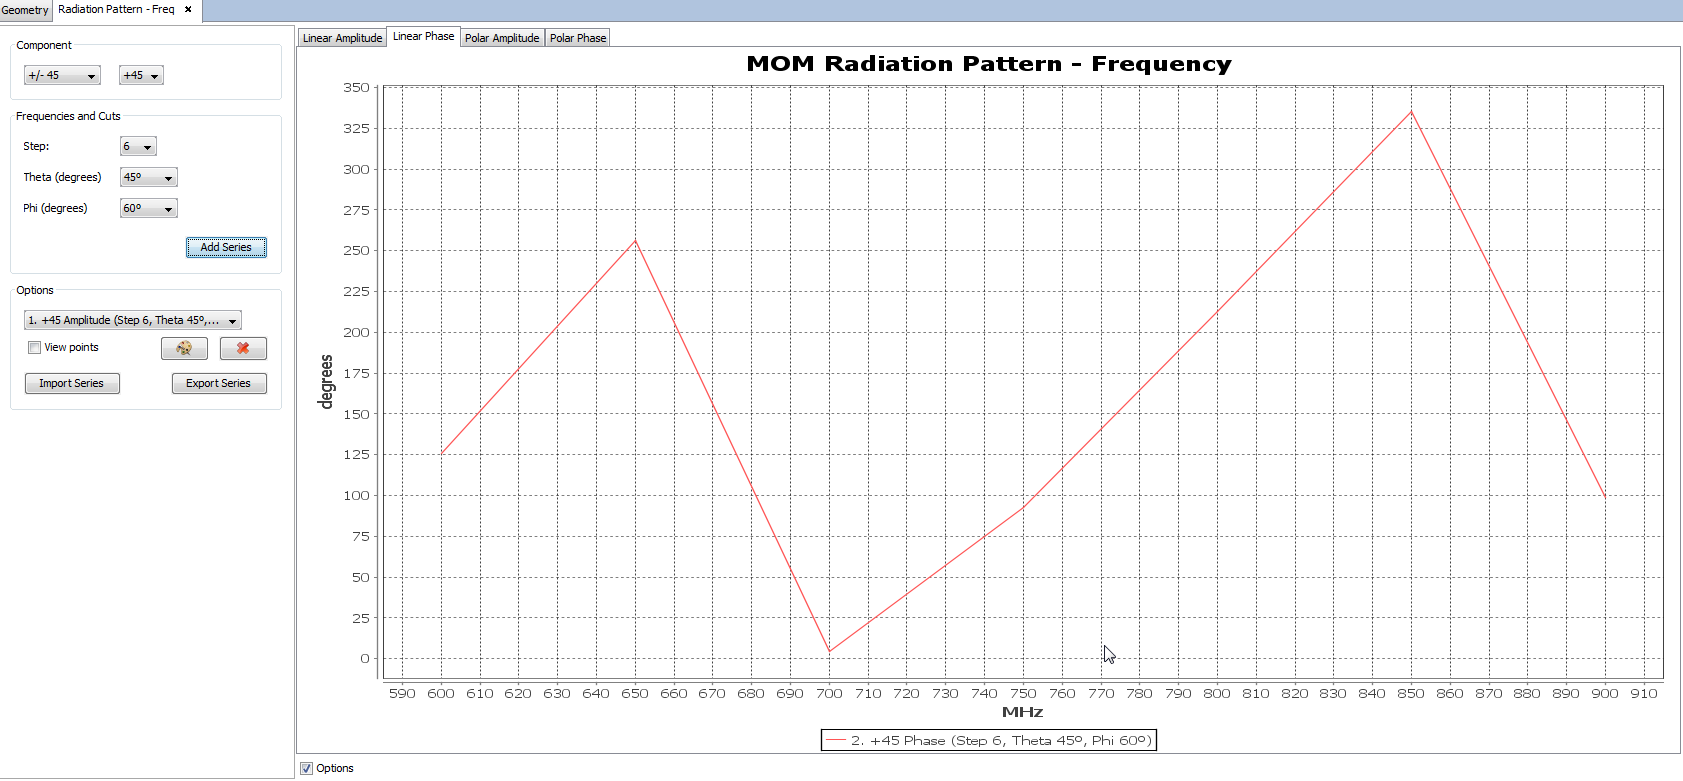
Figure 2. Radiation Pattern View Cuts panel by frequency. Linear Phase
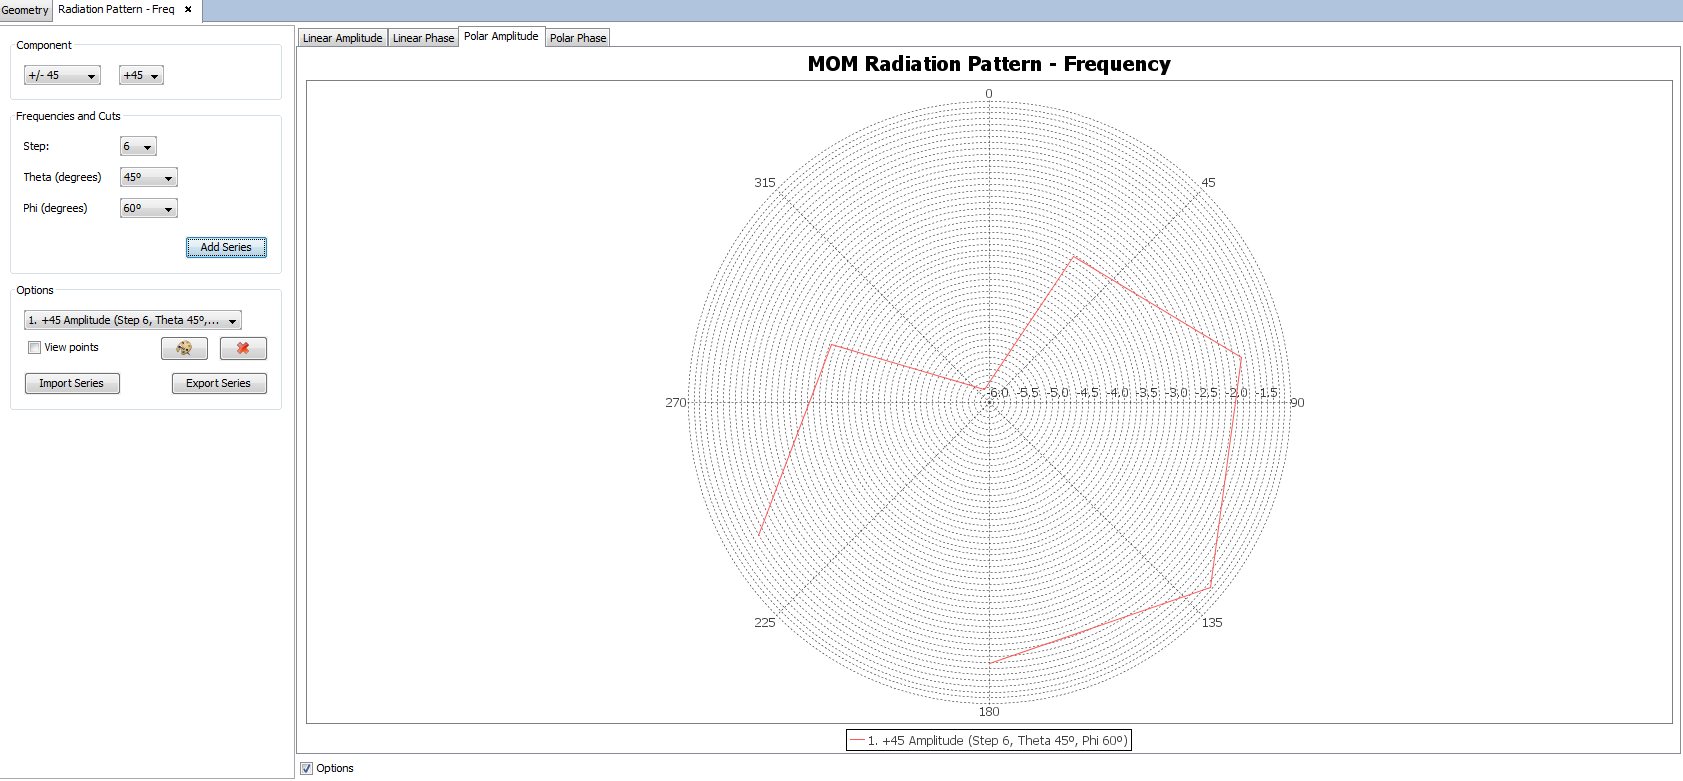
Figure 3. Radiation Pattern View Cuts panel by frequency. PolarAmplitude
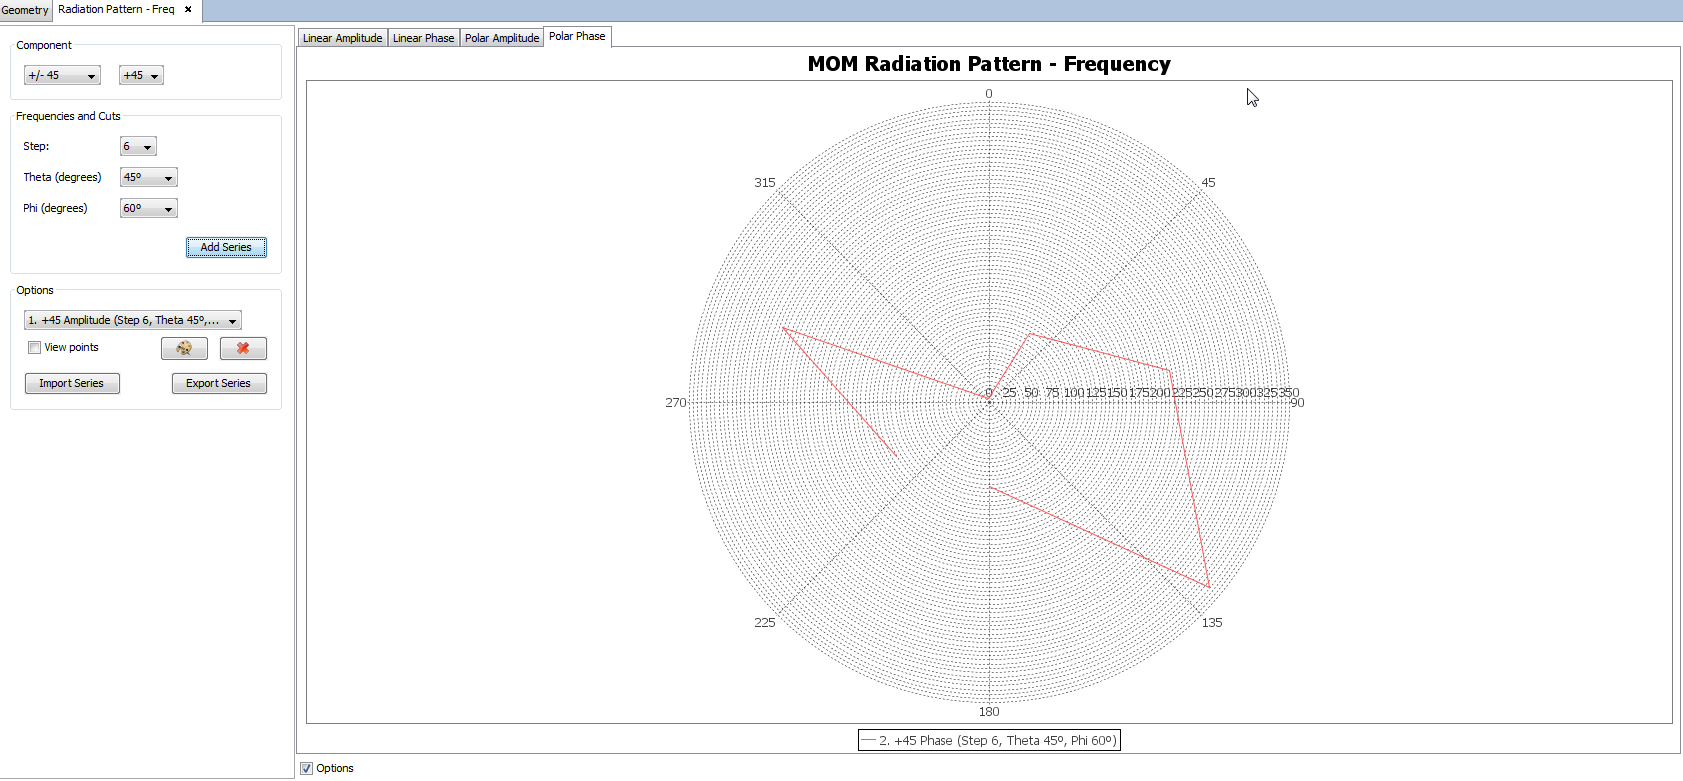
Figure 4. Radiation Pattern View Cuts panel by frequency. Polar Phase