Show Results Menu
This menu allows the user to visualize the results of the simulation. The results are stored in external files that the user can access to obtain the information corresponding to that simulation.
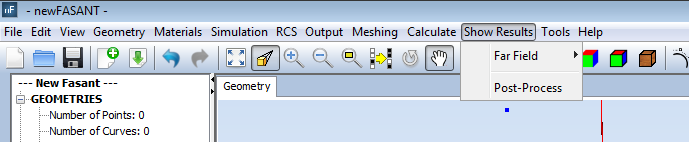
Figure 1. Show Result menu
Most of the plots show 2-D curves of a result field versus an input parameter. This type of graphics share additional features of zoom, axis and curves edition, and so on. To read more information about the chart options (when clicking on the right button over a chart) see Annex 1: Graphics Advanced Options.