Modify Results Plot
Adjust the display attributes for the results plot.
-
On the Analysis workbench toolbar, click the
 (Results plot) icon.
-
In the drop-down menu, click the desired plot.
The Legend dialog will open and the chosen contour plot will appear in the modeling window.
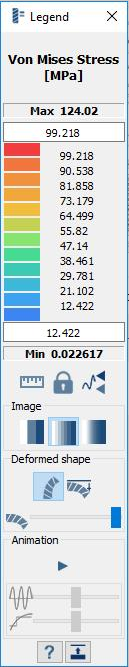
Figure 1. -
Control the contour bounds.
-
Use the Max and Min text
boxes to set upper and lower contour bounds.
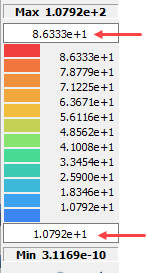
Figure 2. -
Use the
 icon to lock Max and Min contour
bounds.
icon to lock Max and Min contour
bounds.
-
Use the
 icon to show the Max and Min labels in the
modeling window.
icon to show the Max and Min labels in the
modeling window.
-
Use the Max and Min text
boxes to set upper and lower contour bounds.
-
Use the
 icon to show deformed shapes in the modeling window.
-
Change deformation scale factor.
-
Click the
 (Change max deformation) icon.
- In the dialog, adjust the slider to the desired setting.
- Optional: Select the Show true deformation check box to set deformation to true scale.
-
Click the
-
View/adjust the Animation.
-
Click the
 icon to play the animation.
The slider will show the current frame of the animation:
icon to play the animation.
The slider will show the current frame of the animation: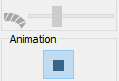
Figure 3. -
Click the
 icon to stop the animation.
-
Use the Animation Speed and Animation
Step sliders to adjust the speed and frames displayed in
the animation.
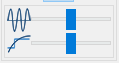
Figure 4.Note: These sliders will only be active when the animation is playing.
-
Click the