View the Status of Jobs at a Glance

View a summary of jobs submitted to an HPC cluster.

View the Status of a Cluster's Jobs

View a graphical representation of the status of a cluster's jobs.

  1. Click the Monitor tab.
  2. Click the Jobs tab from the PBS Professional menu located on the left-hand side of the web page.
    A summary of all HPC clusters are displayed. Each cluster is represented by a row containing the cluster name, the number of jobs submitted to the cluster, the number of cores requested, the number of users who have submitted jobs to the cluster, and a colored bar graphically depicting the status of the jobs.
    Tip: By default, the latest job and node data is automatically retrieved and displayed every 5 minutes. Refresh the data manually by clicking .

    Refresh Data
    Figure 1. Refresh Data
  3. Optional: If the cluster's queues are not visible, click the name of the cluster to expand it.
    The queues belonging to the cluster are displayed. Each queue is represented by a row containing the queue name, the number of jobs submitted to the queue, the number of cores requested, the number of users who have submitted jobs to the queue, and a colored bar graphically depicting the status of the jobs submitted to the queue.
  4. Optional: If the users who have submitted jobs to the queue are not visible, click the name of the queue to expand it.
    The users who have submitted jobs to the queue are displayed. Each user is represented by a row containing the user's name, the number of jobs submitted to the queue by that user, the number of cores requested by that user, and a colored bar graphically depicting the status of the jobs submitted by the user.

Understanding the Job View

A high-level view of the status of an HPC cluster's jobs.

Each cluster is represented by a row containing:
  • the cluster name
  • the number of jobs submitted to the cluster
  • the total number of CPUs requested
  • the number of users who have submitted jobs to the cluster
  • a colored bar graphically depicting the condition of the jobs. The length of a color indicates the ratio of jobs in each condition.
The below table describes the conditions represented by each color and the associated job states/substates.
Color Condition State/Substate
Gray No Jobs to Report N/A
Red Requires Attention
  • waiting with a substate of 37 (waiting due to file stage in failure)
  • held with a substate of 20 (user or operator hold)
Blue Not Running
  • queued
  • suspended
  • suspended due to workstation becoming busy
  • waiting with any substate except 37
  • held with any substate except 20
Green Running
  • running
  • exiting
  • transitioning

Expand a cluster to view the status of jobs submitted to its queues. Expand a queue to view the status of jobs submitted by users to that queue.
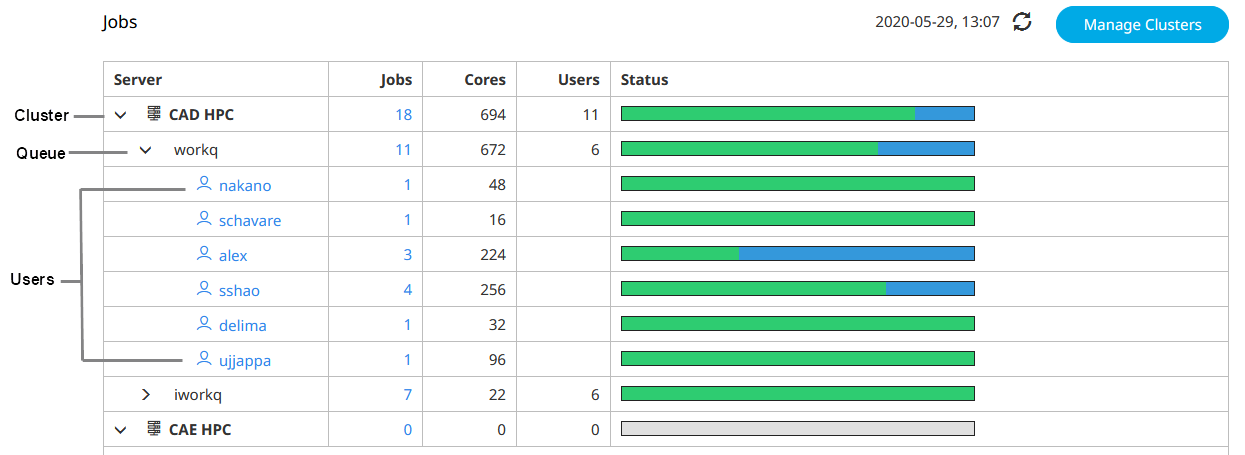

Jobs View
Note: indicates the credentials of the user that was used when adding the cluster have changed server-side, therefore the cluster is registered but unreachable. indicates that there are not enough licenses available to show cluster summary or detail information.
Figure 2. Jobs View