Formatting the Graph
Format the line colour, marker colour and marker style of a trace. Add a line, arrow (single or double), rectangle or circle to the graph to highlight certain aspects of the graph.
-
Select a trace to format.
- On the result palette, in the traces panel, select VoltageSource1_1.
-
Change the line colour to red.
-
On the Format tab, in the
Line group, click the
 Line colour icon. From the drop-down list, select the colour
red.
-
On the Format tab, in the
Line group, click the
-
Change the marker style to a triangle.
-
On the Format tab, in the
Marker group, click the
 Marker style icon. From the drop-down list select the
triangle.
-
On the Format tab, in the
Marker group, click the
-
Change the marker colour to match the colour of the trace.
-
On the Format tab, in the
Marker group, click the
 Marker colour icon. From the drop-down list select the colour
red.
-
On the Format tab, in the
Marker group, click the
-
[Optional] Repeat Step 4 and Step 5 to change the legend position and remove the graph footer.

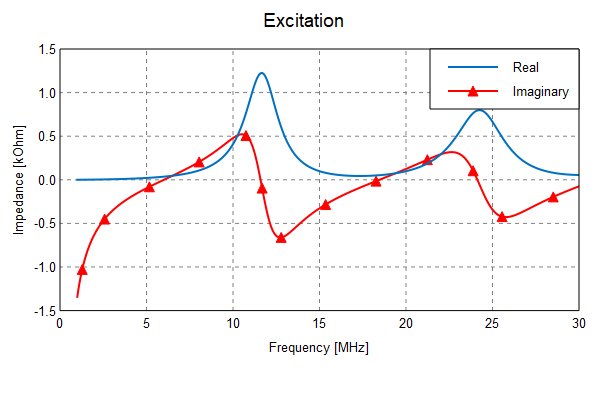
Figure 1. An example of a formatted graph. -
[Optional] Add a line, arrow, double arrow, rectangle or circle to the graph to
highlight an aspect on the graph.
-
On the Format tab, in the
Drawing group, click the
 Shapes icon. Select the required item from the drop-down list.
-
On the Format tab, in the
Drawing group, click the