pulstran
Generate a pulse train, with the pulse defined either by a function or a sampled pulse.
Syntax
pt = pulstran(t, d, 'func')
pt = pulstran(t, d, 'func', p1, p2, ...)
pt = pulstran(t, d, p)
pt = pulstran(t, d, p, fsp)
pt = pulstran(t, d, p, fsp, method)
Inputs
- t
- The times at which to generate the pulse train.
- d
- When d is a vector it contains the time delay for each pulse in the train. See comments.
- 'func'
- The function to generate the individual pulses.
- p1, p2, ...
- The optional parameters to pass to 'func'.
- p
- The sampled pulse to be replicated in the train.
- fsp
- The sampling frequency for p.
- 'method'
- The interpolation method used with replicated p pulses.
Outputs
- pt
- The sampled pulse train.
Example 1
Plot a train of 2 ms rectangular pulses at 5 ms intervals.
fs = 20000;		% sampling rate of the output
ts = 1 / fs;
fp = 200;		% pulse rate
tp = 1 / fp;
t = [0:ts:4*tp];
d = [0:tp:4*tp];
w = .4 * tp;
p = pulstran (t, d, 'rectpuls', w);
plot(1000 * t, p);
title ('Train of 2 ms rectangular pulses at 5 ms intervals');
xlabel ('Time (ms)');
ylabel ('Amplitude');
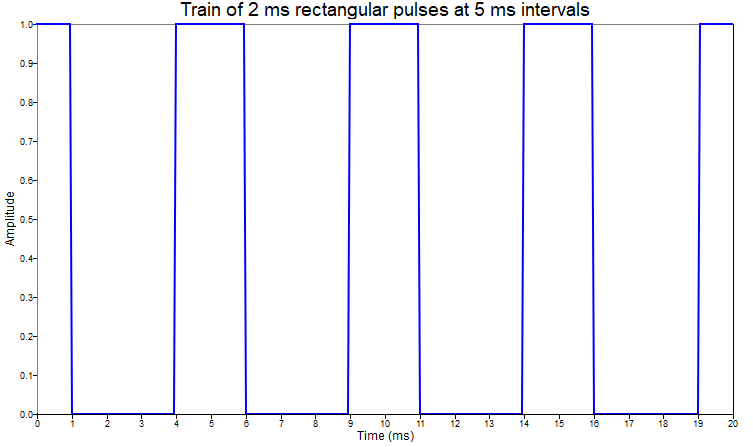
Figure 1. pulstran figure 1
Example 2
Plot a train of user defined at 5 ms intervals, with increasing amplitude.
fs = 10000;		% sampling frequency of the output
ts = 1 / fs;
fp = 200;		% pulse frequency
tp = 1 / fp;
t = [0:ts:4*tp];
d = [0:tp:4*tp] + 0.5*tp;
np = length(d);
d = [d',[1:np]'];
p = [0.010 0.134 0.409 0.800 1.000 0.800 0.409 0.134 0.010];
fsp = 3200;		% sampling frequency of p
x = pulstran (1000 * t, d, p, fsp, 'pchip');
plot(t, x);
xlabel ('Time (ms)');
ylabel ('Amplitude');
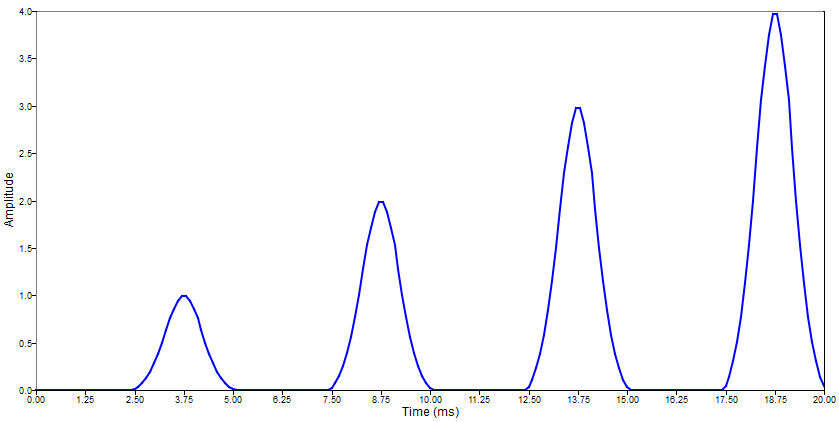
Figure 2. pulstran figure 1
Comments
It is important to note that when using 'func' the delay times apply to the centers of the pulses, but when using p the delay times apply to the left endpoints of the pulses.
When using 'func' = 'gauspuls', gauspuls('cutoff', fc, bw, bwr, tpr) is called to set the pulse width, so 'tpr' can be passed to pulstran as 'p4'.