Composite Failure Model

In Radioss the following composite failure models may be used to describe composite material failure.
  • /FAIL/HASHIN
  • /FAIL/PUCK
  • /FAIL/LAD_DAMA
  • /FAIL/CHANG

A composite material consists of two different materials (matrix and reinforcement fiber). Each material has a different failure behavior. In Radioss it is possible to use different failure models for matrix and fiber in one composite element (for elements with property TYPE11, TYPE16, TYPE17, TYPE51, PCOMPP or TYPE22). For example, you may use /FAIL/HASHIN for fiber failure, /FAIL/PUCK for matrix failure and /FAIL/LAD_DAMA for delamination between layers or plies (if there is more than one layer or plies defined for the composite).

Besides the above typical composite failure models, /FAIL/FLD (used for isotropic brittle composite materials in layers(plies) as in, glass), /FAIL/ENERGY, /FAIL/TBUTCHER and /FAIL/TENSSTRAIN may also be used to describe failure for composite layers(plies).

/FAIL/HASHIN

In HASHIN failure, two primary failure modes are considered.
  • Fiber mode: composite fails, due to fiber rupture in tension or fiber buckling in compression. So, in /FAIL/HASHIN, tensile/shear fiber mode, compression fiber mode and crush mode are the fiber modes. If direction 1 is the fiber direction, then plane 23 is the predominant failure plane for fiber mode.
  • Matrix mode: composite fails, due to matrix cracking from the fiber. Failure matrix mode (or shear failure matrix mode) and delamination mode are both matrix modes. The failure plane for matrix mode is parallel to the fiber, and stress σ11σ11 will not be considered in this mode.


Figure 1. Fiber modes and matrix modes for uni-directional lamina model
Fibers in uni-directional lamina model 1 are only in one direction and in fabric lamina model are in two directions.
Uni-directional Lamina Model Fabric Lamina Model
Damage criteria If DD=1, then failure.

If 0D<10D<1, DD then no failure.

With D=Max(F1,F2,F3,F4)D=Max(F1,F2,F3,F4)

If DD=1, then failure.

If 0D<10D<1, DD then no failure.

With D=Max(F1,F2,F3,F4)D=Max(F1,F2,F3,F4)

Tensile/shear fiber mode F1=(σ11σt1)2+(σ212+σ213σf122)F1=(σ11σt1)2+(σ212+σ213σf122) F1=(σ11σt1)2+(σ212+σ213σfa2)F1=(σ11σt1)2+(σ212+σ213σfa2)

F2=(σ22σt2)2+(σ212+σ223σfb2)F2=(σ22σt2)2+(σ212+σ223σfb2)

With, σfa=σf12,σfb=σf12σt2σt1σfa=σf12,σfb=σf12σt2σt1

Compression fiber mode F2=(σaσc1)2F2=(σaσc1)2

With σa=σ11+σ22+σ332σa=σ11+σ22+σ332

F3=(σaσc1)2F3=(σaσc1)2

With σa=σ11+σ33σa=σ11+σ33

F4=(σbσc2)2F4=(σbσc2)2

With σb=σ22+σ33σb=σ22+σ33

Crush mode F3=(pσc)2F3=(pσc)2

With p=σ11+σ22+σ333p=σ11+σ22+σ333

F5=(pσc)2F5=(pσc)2

With p=σ11+σ22+σ333p=σ11+σ22+σ333

Shear failure matrix mode F6=(σ12σm12)2F6=(σ12σm12)2
Failure matrix mode F4=(σ22σt2)2+(σ23S23)2+(σ12S12)2F4=(σ22σt2)2+(σ23S23)2+(σ12S12)2

Where,

S12=σm12+σ22tanϕS23=σm23+σ22tanϕS12=σm12+σ22tanϕS23=σm23+σ22tanϕ

Delamination mode F5=S2del[(σ33σt3)2+(σ23˜S23)2+(σ13S13)2]F5=S2del(σ33σt3)2+(σ23˜S23)2+(σ13S13)2

Where,

S13=σm13+σ33tanϕ˜S23=σm23+σ33tanϕS13=σm13+σ33tanϕ˜S23=σm23+σ33tanϕ

F7=S2del[(σ33σt3)2+(σ23S23)2+(σ13S13)2]F7=S2del(σ33σt3)2+(σ23S23)2+(σ13S13)2

Where,

S13=σm13+σ33tanϕ˜S23=σm23+σ33tanϕS13=σm13+σ33tanϕ˜S23=σm23+σ33tanϕ

Note: a={aifa>00ifa<0a={aifa>00ifa<0

In /FAIL/HASHIN, material strength σt1,σt2,σt3,σc1,σc2σt1,σt2,σt3,σc1,σc2 are derived from tension/compression test for composite.

Crush strength σcσc and fiber shear strength σf12σf12 may be obtained from a quasi-static punch shear test (QS-PST). 6 Crush strength σcσc from the span to punch ratio (SPR) =0 and fiber shear strength σf12σf12 from SPR=1.1.

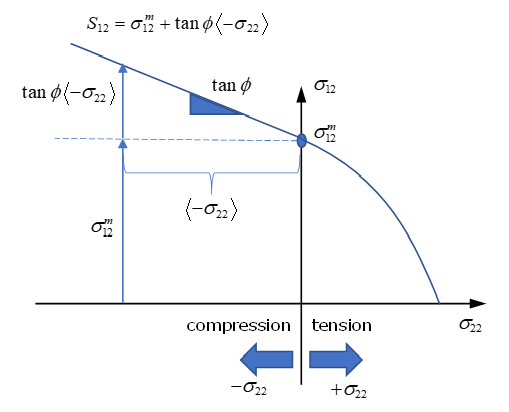
ϕϕ is the Coulomb friction angle. It is observed that composite shear strength is higher if the composite is also under compression (rather than under tension). This is due to the friction between matrix and fiber.

The shear strength is assumed to be proportional to compression stress and is computed as:(1) S12=σm12+σ22tanϕS12=σm12+σ22tanϕ


Figure 2.
Friction angle ϕϕ may be fitted with an Off-Axis compression test with different angles θθ (for example, 30,45,6030,45,60, …).


Figure 3.

σm12,σm13,σm23σm12,σm13,σm23 may be derived from a matrix shear test in three directions.

SdelSdel is the scale factor for delamination criteria. It may be fitted with composite delamination experimental datain order for delamination failure to correlate with the damage area in experiment.

/FAIL/PUCK

In Puck failure, two types of failure are considered.
  • Fiber fracture: composite fails, due to the fiber reaching the tensile or compression strength limit.
  • Inter fiber failure (IFF): composite fails, due to the fiber matrix cracking.
Damage criteria If DD=1, then failure.

If 0D<10D<1 DD, then no failure.

With D=Max(ef(tensile),ef(compression),ef(ModeA),ef(ModeB),ef(ModeC))D=Max(ef(tensile),ef(compression),ef(ModeA),ef(ModeB),ef(ModeC))

Fiber fraction failure Tensile fiber failure mode: σ11>0σ11>0

ef(tensile)=σ11σt1ef(tensile)=σ11σt1

Compressive fiber failure mode: σ11<0σ11<0

ef(compression)=|σ11|σc1ef(compression)=|σ11|σc1

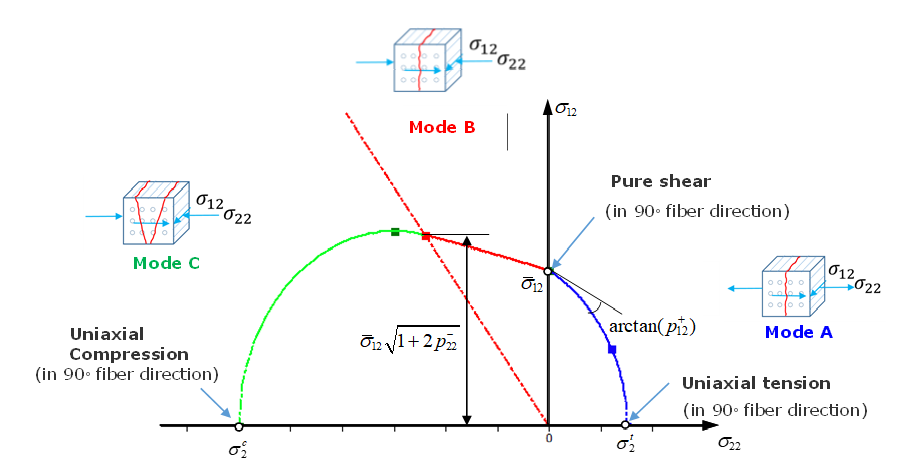
Inter fiber failure (IFF) 2 Mode A, if σ22>0σ22>0:

fail_puck_modeA
Figure 4.

ef(ModeA)=1ˉσ12[(ˉσ12σt2p+12)2σ222+σ122+p+12σ22]ef(ModeA)=1¯σ12 (¯σ12σt2p+12)2σ222+σ122+p+12σ22

Mode C, if σ22<0σ22<0:

fail_puck_modeC
Figure 5.

ef(ModeC)=[(σ122(1+p22)ˉσ12)2+(σ22σc2)2](σc2σ22)ef(ModeC)=(σ122(1+p22)¯σ12)2+(σ22σc2)2(σc2σ22)

Mode B:

fail_puck_modeB
Figure 6.

ef(ModeB)=1ˉσ12(σ212+(p12σ22)2+p12σ22)ef(ModeB)=1¯σ12(σ212+(p12σ22)2+p12σ22)

In inter fiber failure, Mode A shows failure under tension in transverse fiber direction (90 degrees to fiber direction), and in this case, shear loading could reduce the failure limit.

If under compression in transverse fiber direction, at first increasing compression will increase composite shear loading (Mode B). If compression continues to increase, then shear loading will decrease (Mode C).

Input Parameters

For fiber fracture failure, you could obtain fiber strengths σt1,σc1σt1,σc1 from tension and compression composite tests in the fiber direction.

For inter fiber failure, you could obtain strengths σt2,σc2σt2,σc2 from tension and compression composite tests in the transverse fiber direction.

You could obtain shear strength ˉσ12¯σ12 with a pure shear test (σ2=σ1=0σ2=σ1=0).

With σt2,σc2,ˉσ12σt2,σc2,¯σ12, then p22p22 and p12p12 for Mode C and Mode B may be determined.

With σt2,ˉσ12σt2,¯σ12 and additional tension-shear tests in the transverse fiber direction, p+12p+12 may be determined. The additional tension-shear test in transverse fiber direction could take equal tension-shear (by σ22=σ12σ22=σ12) loading.

Then you may derive the fracture curve in σ22σ12σ22σ12 plane, as shown below.


Figure 7. IFF fracture curve in σ22σ12σ22σ12 plane

For p+12,p12,p22p+12,p12,p22 parameters 3. For carbon fiber composite, use p+12=0.35,p12=0.3,p22=0.2p+12=0.35,p12=0.3,p22=0.2 and for glass fiber composite, use p+12=0.3,p12=0.25,p22=0.2p+12=0.3,p12=0.25,p22=0.2.

/FAIL/LAD_DAMA

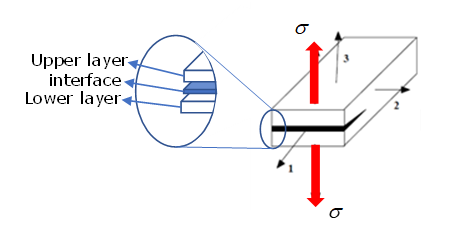
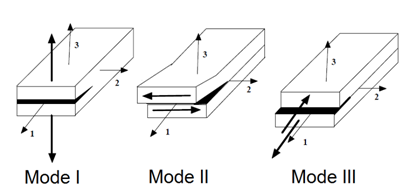
/FAIL/LAD_DAMA is used to describe delamination between composite layers (damage propagation in the matrix). Assume that layers are connected through a virtual interface (contact).


Figure 8.
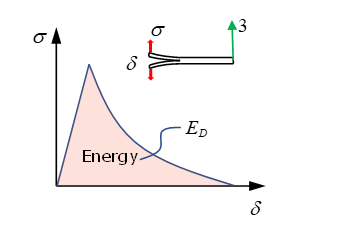
For example, if composite is under loading, shown below, the traction σσ and displacement in direction 3 δδ is as shown in curve.


Figure 9.
The area under the traction versus displacement curve is the absorbed energy by delamination, which is also termed the strain energy of the damage interface. The failure is governed by this strain energy is described below, considering 3 Modes of delamination:(2) ED=12[σ332K3(1d3)+σ332K3+σ322K2(1d2)+σ312K1(1d1)]ED=12[σ332K3(1d3)+σ332K3+σ322K2(1d2)+σ312K1(1d1)]
Where, σ33,σ32,σ31σ33,σ32,σ31 are the stresses shown below in three modes of delamination behavior.

fail_lad-dama_delam1A
Figure 10.
With strain energy of delamination EDED, the thermodynamic force (contact force of virtual interface), also termed damage energy release rates may be calculated for these three modes:
  • Model I (DCB specimen 5)

    Yd3=EDd3|σ=cst=12σ332K3(1d3)2Yd3=EDd3σ=cst=12σ332K3(1d3)2

  • Model II (ENF specimen 5)

    Yd2=EDd2|σ=cst=12σ322K2(1d2)2Yd2=EDd2σ=cst=12σ322K2(1d2)2

  • Model III

    Yd1=EDd1|σ=cst=12σ312K1(1d1)2Yd1=EDd1σ=cst=12σ312K1(1d1)2

Where, K3,K2,K1K3,K2,K1 are the stiffnesses of the virtual interface, also called interlaminar stiffness. These values may be computed as:(3)
K3=2E33tK3=2E33t
K2=2G23tK2=2G23t
K1=2G13tK1=2G13t
Where,
tt
Thickness of the virtual interface. It may be assumed to be 1/5 layer thickness.
G13G13, G23G23, E33E33
From upper or lower layer.
didi
(with ii=1,2,3), the damage variable.
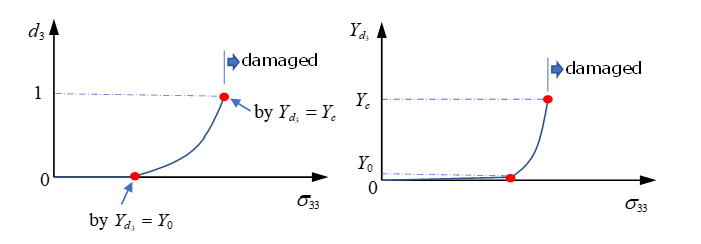
It has a range from 0~1. It starts to accumulate once the composite reaches Y0Y0.
An example of Mode I, during traction in direction 3, at the beginning d3d3 always remains 0 until thermodynamic force Yd3Yd3 reaches Y0Y0 (left figure).


Figure 11.

After Y0Y0 is reached, the damage variable starts to increase and when it reaches 1, d3=1d3=1 (thermodynamic force Yd3Yd3 at this point then becomes the critical damage YcYc). The composite could be considered as fully delaminated and may be deleted immediately or the stress may be reduced. In Radioss, the option τmaxτmax is used to simulate exponential function stress reduction nd the stress at YcYc is σd(tr)σd(tr) (Stress Decrease in Damage).

The relation with thermodynamic force YdiYdi and didi is:
  • If d1d1, then take d=1d=1
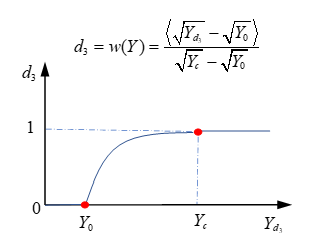
  • If d<1d<1, then dd is function of YY (damage evaluation law):(4) d=w(Y)=YY0YcY0d=w(Y)=YY0YcY0

    Y=Yd3+γ1Yd1+γ2Yd2Y=Yd3+γ1Yd1+γ2Yd2 with Ydi|t=supYdi|τtYdi|t=supYdi|τt

    Here, γ1,γ2γ1,γ2 are scale factors to consider two other delamination modes. This may be validated with experiments (DCB and ENF specimen test 5).

In the example of Mode I, γ1,γ2γ1,γ2 may be 0 as this is pure delamination in direction 3 and then Y=Yd3Y=Yd3, the relation of Yd3Yd3 and d3d3 is:


Figure 12.
How quickly will the damage variable increase? The damage velocity ˙d˙d (also called damage evaluation law) is computed as:
  • If d=1d=1, then ˙d=const.˙d=const.
  • If d<1d<1, then ˙d=ka[1exp(aw(Y)d)]˙d=ka[1exp(aw(Y)d)]
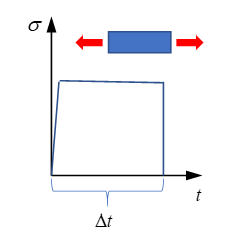
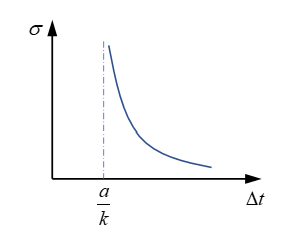
kaka is the maximum damage rate, which means minimum duration of the failure phenomenon. Its reciprocal, akak is called the characteristic time, which may be obtained with a one-dimension tensile test. 7


Figure 13.
Through tensile sample with different stress to find the minimum time of composite damage ΔtΔt, the σΔtσΔt curve is vertical asymptote corresponding to the characteristic time akak.


Figure 14.
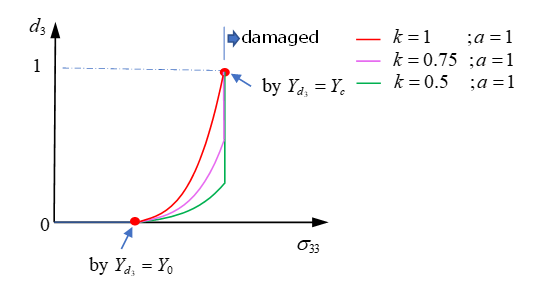
Parameters aa and kk govern the damage evaluation law. For example, with constant parameter aa (here a=1a=1), decreasing values of kk leads to more brittle failure of the composite.


Figure 15.
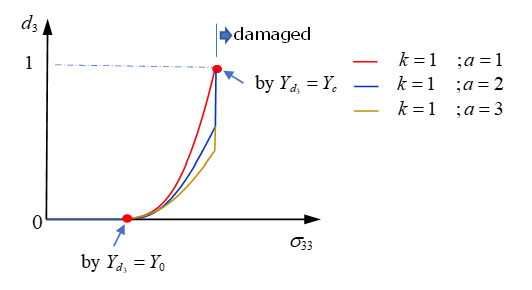
With constant parameter kk (here k=1k=1), increasing values of aa leads to more brittle failure of the composite.


Figure 16.

/FAIL/CHANG

In Chang-Chang failure, two primary failure modes are considered.
  • Fiber mode: composite fails, due to fiber rupture in tension or fiber buckling in compression.
  • Matrix mode: composite fails, due to matrix failure under tension or compression.
This failure criteria is used only for shell elements.
Damage criteria If D=1D=1, then failure.

If 0D<10D<1 DD, then no failure.

With D=Max(ef2,ec2,em2,ed2)D=Max(ef2,ec2,em2,ed2).

Fiber breakage Tensile fiber mode σ11>0σ11>0 ef2=(σ11σt1)2+β(σ12ˉσ12)2ef2=(σ11σt1)2+β(σ12¯σ12)2
Compression fiber mode σ11<0σ11<0 ec2=(σ11σc1)2ec2=(σ11σc1)2
Matrix cracking Tensile matrix mode σ22>0σ22>0 em2=(σ22σt2)2+(σ12ˉσ12)2em2=(σ22σt2)2+(σ12¯σ12)2
Compressive matrix mode σ22<0σ22<0 ed2=(σ222ˉσ12)2+[(σc22ˉσ12)21]σ22σc2+(σ12ˉσ12)2ed2=(σ222¯σ12)2+[(σc22¯σ12)21]σ22σc2+(σ12¯σ12)2
Where,
direction 1
Fiber direction.
σt1,σc1σt1,σc1
Fiber tensile/compressive strength.
σt2,σc2σt2,σc2
Matrix strength.
Tensile or compressive loading in direction 2 (transverse to direction 1).
ˉσ12¯σ12
Shear strength in composite ply plane.
ββ
Shear scale factor, which can be determined experimentally.

Stress Decrease in Damage

After reaching the damage criteria:
  • HASHIN:

    D=Max(F1,F2,F3,F4)1D=Max(F1,F2,F3,F4)1

  • PUCK:

    D=Max(ef(tensile),ef(compression),ef(ModeA),ef(ModeB),ef(ModeC))1D=Max(ef(tensile),ef(compression),ef(ModeA),ef(ModeB),ef(ModeC))1

  • LAD_DAMA:

    d1d1

  • CHANG:

    D=Max(ef2,ec2,em2,ed2)1D=Max(ef2,ec2,em2,ed2)1

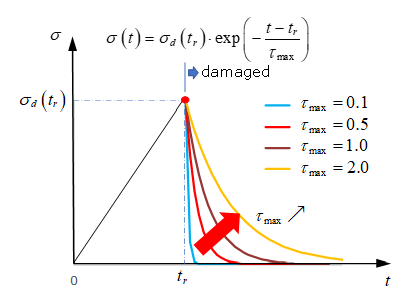
Stresses start decreasing and decrease gradually by using an exponential function to avoid numerical instabilities.(5) σ(t)=σd(tr)f(t)       =σd(tr)exp(ttrτmax)

with, ttr

The option τmax controls how gradually the stress is decreased in damage.


Figure 17.
Where,
σd(tr)
Stress components when damage is reached D1.
tr
Time of σd(tr).
τmax
Time of dynamic relaxation.
The higher the value of τmax, the slower stress decreases during damage. Normally, it takes 10~20 time step.

References

1
Hashin, Z., "Failure Criteria for Unidirectional Fiber Composites," Journal of Applied Mechanics, Vol. 47, 1980, pp. 329-334.
2
A. Puck, J. Kopp, and M. Knops., “Failure analysis of FRP laminates by means of physically based phenomenological models”. Composites Science Technology, 62. pp. 1633-1662. 2002.
3
A. Puck, J. Kopp, and M. Knops. “Guidelines for the determination of the parameters in Puck's action plane strength criterion”. Composites Science Technology 62. pp. 371-378. 2002.
4
L. Gornet, “Finite Element Damage Prediction of Composite Structures”.
5
Ladevèze, P., Allix, O., Douchin, B., Lévêque, D., “A Computational Method for damage Intensity Prediction in a Laminated Composite Structure”, Computational mechanics—New Trends and Applications In: Idelsohn, S., Oñate E., and Dvorkin E., (eds.) CIMNE, Barcelona, Spain (1998).
6
Gama B.A., Gillespie J.W., Punch Shear Behavior of Composites at Low and High Rates[M]// Fracture of Nano and Engineering Materials and Structures. Springer Netherlands, 2006.
7
Allix, O. & Deü, Jean-François. (1997). Delay-damage modeling for fracture prediction of laminated composites under dynamic loading. Engineering Transactions. 45. 29-46.