datetick
Sets date formatted ticks on axis.
Syntax
datetick()
datetick(fmt)
datetick(axisStr, fmt)
datetick(..., option)
datetick(hAxes, ...)
Inputs
- fmt
- The format of the date tick labels. The value can be either the index of one of the predefined formats or a string. For more information on date formats, see datestr.
- axisStr
- The axis string ('x' or 'y') to set the date ticks. Default value is 'x'.
- option
- Specifies if the axis range or the axis ticks are preserved. Valid values are:
- 'keeplimits' - The axis limits are preserved and datestr is applied only on visible tick labels.
- 'keepticks' - datestr is applied on the ticks defined by setting a vector value for the 'xtick' or 'ytick' property of the axis.
- hAxes
- Axis handle.
Examples
Simple datetick example:
clf;
x = datenum(2000:2:2020, 1, 1);
y = [10 50 80 60 70 60 40 90 80 80 60];
plot (x, y);
datetick(2)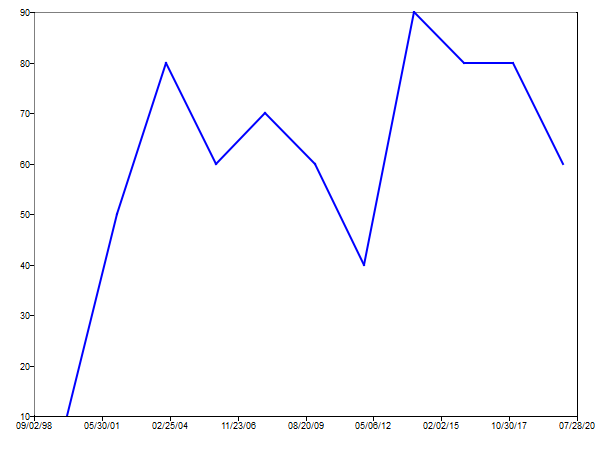
Figure 1. Date tick on x axis
Option 'keeplimits' preserves the axis range set:
clf;
x = datenum(2000:2:2020, 1, 1);
y = [10 50 80 60 70 60 40 90 80 80 60];
plot (x, y);
xlim([x(3) x(8)])
datetick(2, 'keeplimits')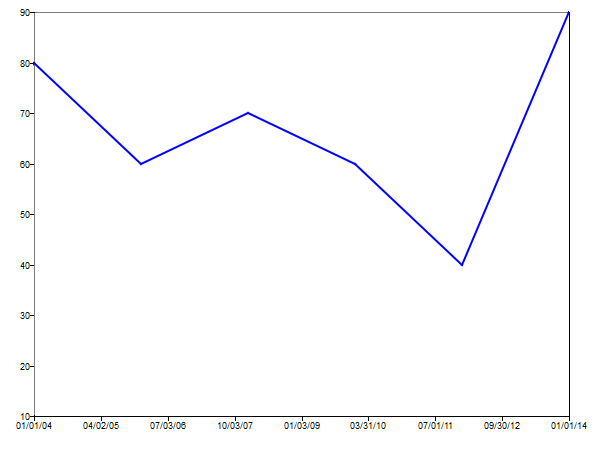
Figure 2. Option 'keeplimits'
For a better visual result, set the tick position and axis limits before calling datetick with the 'keepticks' option:
clf;
x = datenum(2000:2:2020, 1, 1);
y = [10 50 80 60 70 60 40 90 80 80 60];
plot (x, y);
set(gca,'xtick', x(1:2:end));
datetick(2, 'keepticks')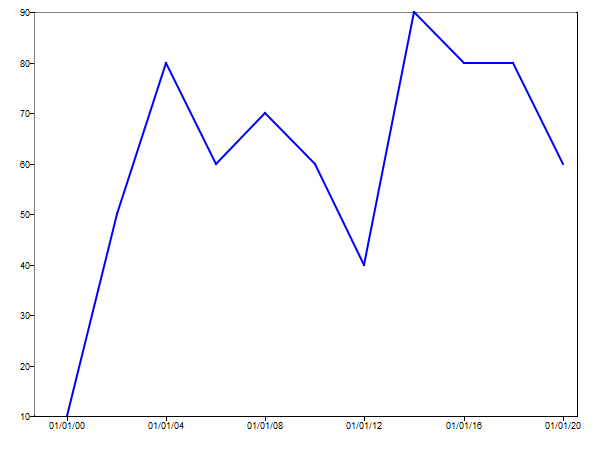
Figure 3. Option 'keepticks'
Set a custom format for the date or time:
clf;
t = datenum(2022,1,1,0:23,0,0);
y = rand(length(t), 1);
plot (t, y);
set(gca,'xtick', t(1:2:end));
xlim([t(1), t(end)]);
datetick('HH:MM PM', 'keepticks')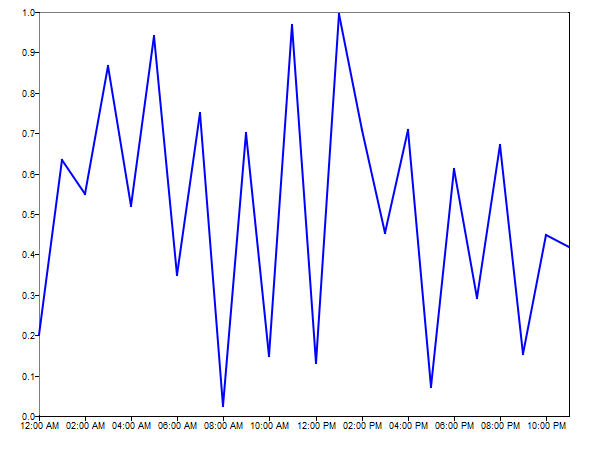
Figure 4. Set custom date format
Set date ticks on y axis:
clf;
x = datenum(2022,1,1:7,0,0,0);
t = datenum(2022,1,1,[15 15 14 14 20 12 21],0,0);
stem(x, t);
set(gca,'xtick', x);
yAxisTicks = datenum(2022,1,1,10:23,0,0);
ylim([yAxisTicks(1), yAxisTicks(end)])
set(gca,'ytick', yAxisTicks);
datetick(1,'keepticks');
datetick('y', 'HH:MM PM', 'keepticks');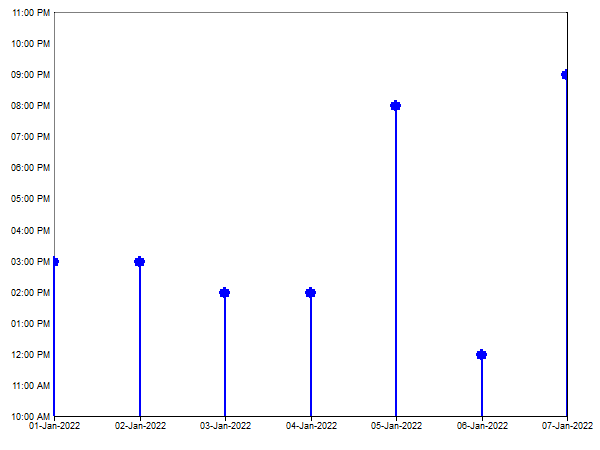
Figure 5. Set date ticks on y axis
Comments
datetick is available only in 2D XY plots.