xline
Add one or more vertical lines in the current axes or specified axes.
Syntax
h = xline(x)
h = xline(..., property, value, ...)
h = xline(hAxes, ...)
Inputs
- x
- Constant point x of vertical line.
- property
- Properties that control the appearance or behavior of the graphics object.
- value
- Value of the properties.
- hAxes
- Axis handle.
Outputs
- h
- Handle of the line graphics object.
Examples
Simple xline example:
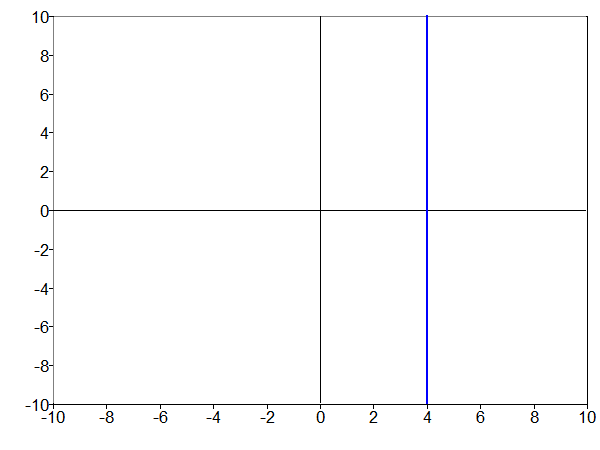 Figure 1. Vertical line at x = 4
clf;
      		h = xline(4);
Create vertical lines and set properties example:
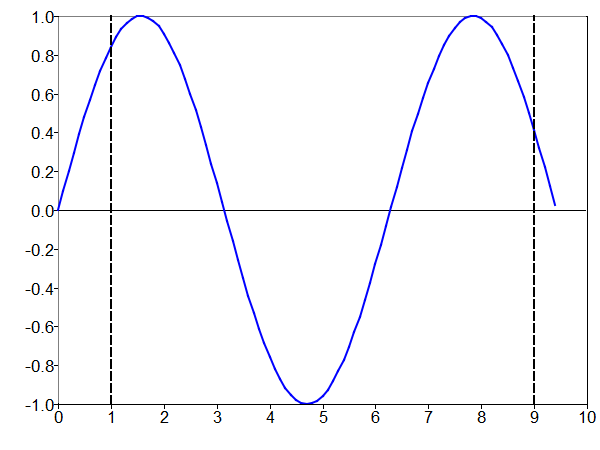 Figure 2. Create 2 lines and set properties
clf;
          	x=[0:0.1:3*pi];
			plot(x, sin(x));
			h = xline([1;9],'color','k','linestyle','--');
Comments
If there is no axis, one is created first. If x is an Mx1 matrix, then M vertical lines are created.
If an axis exists, lines are added to it without clearing existing lines.