legend
Update axes' legend text, turn on/off the legend of axes. Toggle the states if no argument is used.
Syntax
legend()
legend('on')
legend('off')
legend(str1, str2, ...)
legend(str-cell)
legend(h-vector, str-cell)
legend(..., property, value)
lh = legend(...)
Inputs
- on/off
- Determines whether legend is set to on or off.
- str1, str2
- Legend text. str1 is the text for the first curve, str2 is the text for the second curve, etc.
- str-cell
- Legend text in a cell array.
- h-vector
- Handles of the curves which show legends.
- property, value
-
- 'location'
- Specifies the location of the legend.
- 'bordercolor'
- Specifies the border color of the legend using an RGB vector with 3 elements ([R G B]).
- 'borderwidth'
- Specifies the border width of the legend with a scalar.
- 'fontangle'
- Specifies the font angle of the legend.
- 'fontweight'
- Specifies the font weight of the legend.
- 'fontname'
- Specifies the font name of the legend.
- 'fontsize'
- Specifies the fontsize of the legend with a scalar.
- 'visible'
- Specifies the visibility of the legend.
Outputs
- lh
- Handle of the legend.
Example
Simple legend
example.
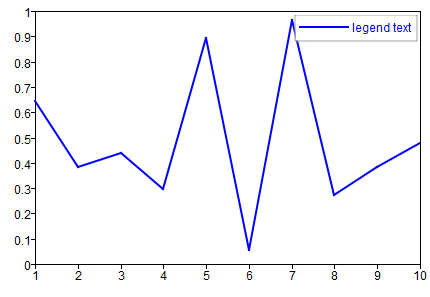
Figure 1. Legend Example 1
clf;
plot(rand(1, 10));
legend('on');
legend('legend text');
Figure 1. Legend Example 1
Add legends for selected
curves.
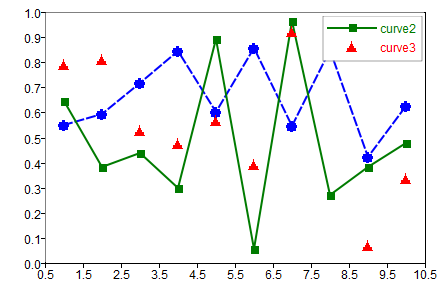 Figure 2. Legend Example 2
clf;
hold on;
h1 = plot(rand(10,1),'--o');
h2 = plot(rand(10,1),'-s');
h3 = plot(rand(10,1),'r^');
legend([h2,h3],{'curve2','curve3'});Set the location of the
legend.
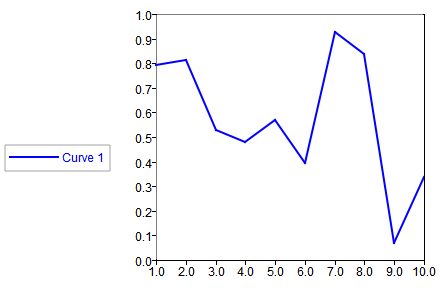
Figure 3. Location string example
clf;
plot(rand(1, 10));
legend('location','westoutside');
Figure 3. Location string example
Set legend location
coordinates.
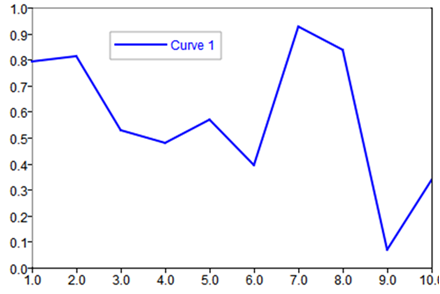
Figure 4. Location coordinates example
clf;
plot(rand(1, 10));
legend('location',[0.2 0.1]);
Figure 4. Location coordinates example
Example retrieving the legend handle.
clf;
plot(rand(1, 10));
h = legend('location',[0.2 0.1]);
get(h)
ans = struct [
bordercolor: [Matrix] 1 x 3
163 163 163
borderwidth: 1
children: [Matrix] 1 x 0
fontangle: regular
fontname: Arial
fontsize: 7
fontweight: normal
handle: 14.4673228
location: [Matrix] 1 x 2
0.20000 0.10000
parent: 19.6851603
tag:
type:
uicontextmenu: 0
units: pixels
visible: on
]Example setting legend properties.
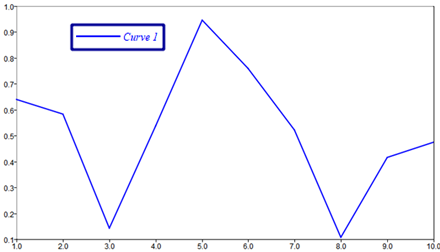
Figure 5. Legend Properties
clf;
plot(rand(1, 10));
h = legend('location',[0.2 0.1]);
set(h,'fontangle','italic');
set(h,'fontname','Times New Roman');
set(h,'borderwidth',3);
set(h,'bordercolor',[0 0 150]);
Figure 5. Legend Properties