After execting the results post-processing, the next step is to study the risks of the
squeak and rattle issues. You can perform the following operations in the Relative Modal
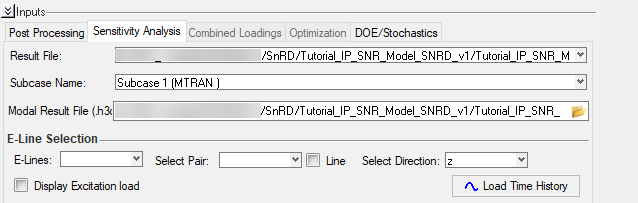
Contribution panel. Figure 1.
E-Line Selection
E-Lines - select Elines in the model
Select Pair - select the respective pair, a node on the line or complete
line
Select Direction - select the plotting direction for
displacement.
Note: By default z direction will be selected, since
the assumption is the relative displacement will occur and captured
in z direction.
Display Excitation Load - view the loading strength plotted in a
HyperGraph window. This loading strength
value is taken from Load Creation.
Load Time History - generate and plot loading time history and relative
displacement plots for the selected Eline and the pair.
Note: Once the
time history is loaded in the session, the next step would be to
study the relative modal contributions.
RMC Calculation -
Max Peak - is enabled only when you are studying modal contributions
based on nodes as the selected pair.
Peak - Value & Time - The plot highlights the peaks values
in relative displacement using horizontal and vertical dashed
lines and also shows labels to highlight the same.
% of Highest Peaks - is enabled only when you are studying modal
contributions based on complete ELine as the selected pair.
Enter the percentage value of peaks that you want to study in
the % of Highest Peaks field.
Select Top Contributors - select the number of top modes
contributing to be plotted and displayed as bar graphs in
descending order of effect.