View Scopes
After running a simulation, view the plotted result data that is defined in the scope blocks.
-
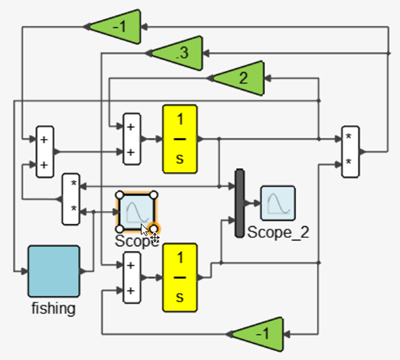
To open a scope window, do one of the following:
- From your model, double-click a scope block.
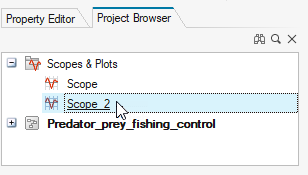
- From the Project Browser, double-click a scope block name:
The scope window opens and displays the plotted results from the selected scope block.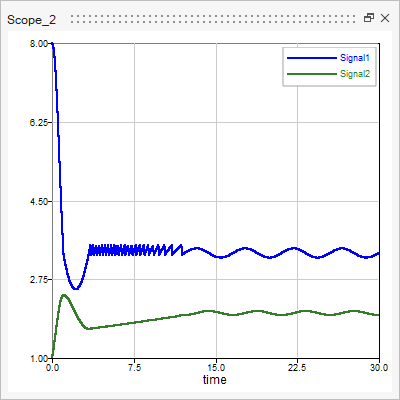
- From your model, double-click a scope block.