HWCFD-T: 3000 Post-Processing
In this tutorial, you will look at some of the post-processing tools available in HyperWorks CFD. You will use an exhaust manifold model to help explore the various options while post-processing the geometry.
Before you begin, click here to download the tutorial models. Extract the Exhaust_Manifold.zip file then save the contents to a working directory.
Load the Results in Post
-
Navigate to your working directory, select the
Exhaust_Manifold.1.Log file, and click
Open.
The solid and all the surfaces are loaded in the Post Browser.
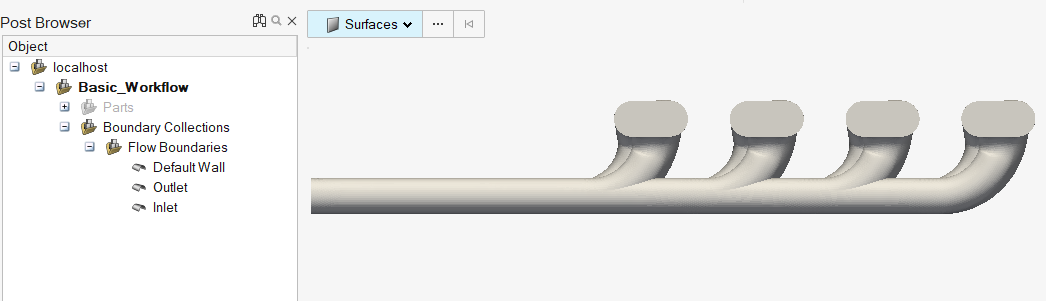
Figure 1.
Create Boundary Groups for the Outer Walls of the Manifold
-
Click the Boundary Groups tool.

Figure 2. -
Select the walls of the manifold, as shown below.
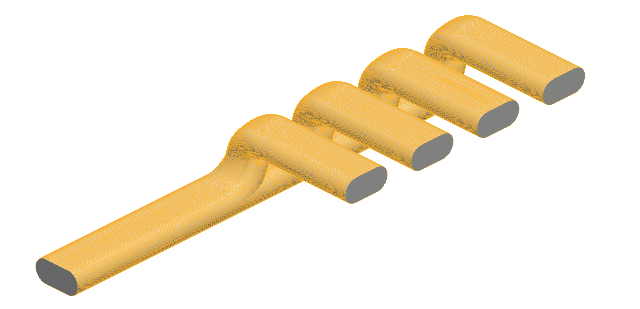 Figure 3.
 -
In the display microdialog, use the slider to set a
transparency for the model.
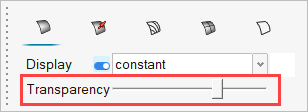
Figure 4. -
Change the color to Black.
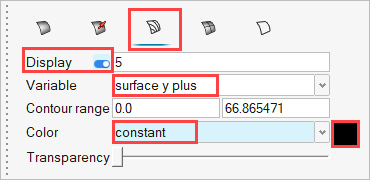
Figure 5. -
On the guide bar, click
 to execute
the command and exit the tool.
to execute
the command and exit the tool.
Set Velocity Contours and Vectors on the Inlets and Outlets
-
Click
 to refresh the legend.
-
Set the Color to velocity.
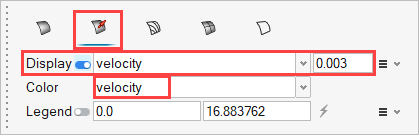
Figure 6. -
On the guide bar, click
to execute
the command and exit the tool.
-
Repeat steps 1-7 for the Outlet surface.
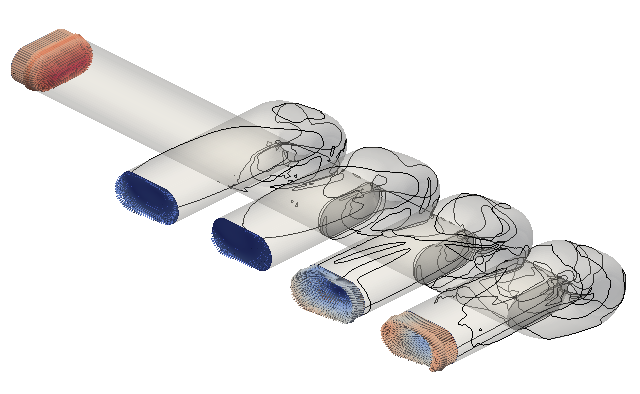
Figure 7.
Set Pressure Contours on the Internal Surfaces
-
Click
 next to Legend.
-
Set the Colormap name to Blue Orange.
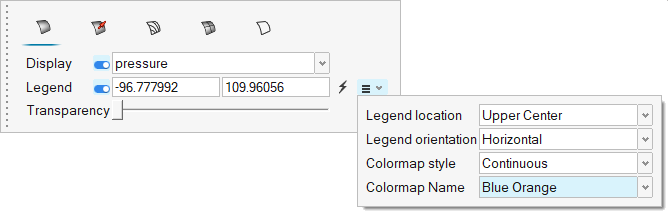
Figure 8. -
On the guide bar, click
to execute
the command and exit the tool.
Visualize Streamlines from the Inlet
-
Click the Streamlines tool.

Figure 9. -
From the secondary ribbon, select the Rectangle
tool.

Figure 10. -
Select the Top face on the View Cube to orient the
model.
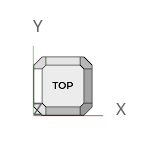
Figure 11. -
Click
 in the microdialog to
active the Move tool.
in the microdialog to
active the Move tool.
-
Enter a value of -0.41 and press Enter.
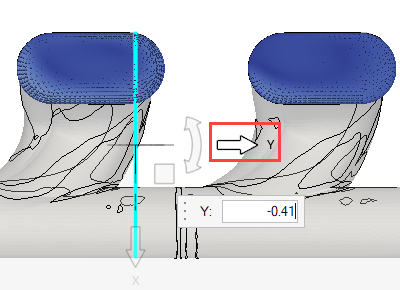
Figure 12. -
Select the Front face on the View Cube.
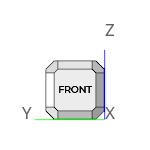
Figure 13. -
Enter a value of 0.05 and press Enter.
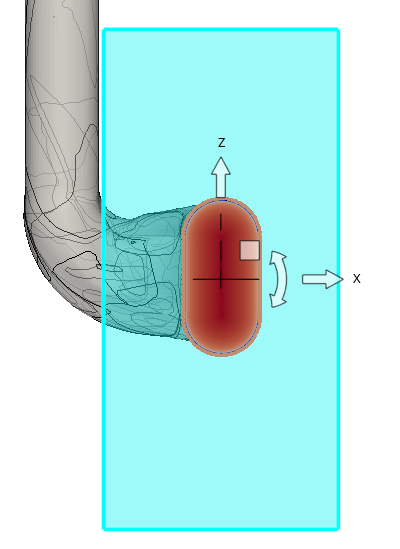
Figure 14. -
Click
 in the microdialog and set
the length and width to 0.06 and
0.11, respectively.
in the microdialog and set
the length and width to 0.06 and
0.11, respectively.
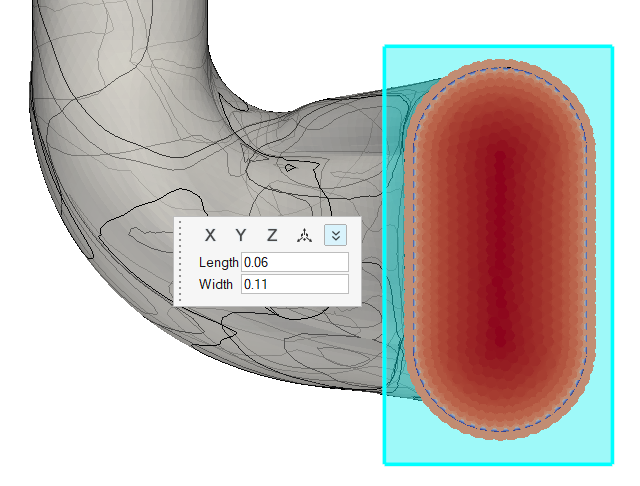
Figure 15. -
Click next to Legend.
-
Set the Colormap name to Rainbow Uniform.
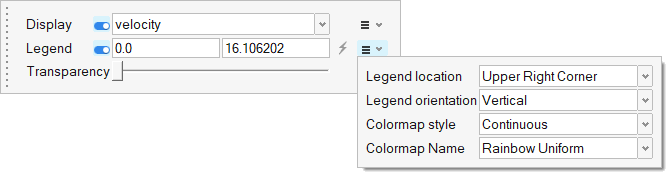
Figure 16. -
On the guide bar, click
to execute
the command and exit the tool.
Animate Streamlines
- Right-click on Streamlines 1 in the Post Browser and select Animate from the context menu.
-
Click
 on the Animation toolbar.
- Set the number of steps to 50 and choose a desired speed.
-
Click
 to start the animation.
Create a Slice Plane
-
Click the Slice Planes tool.

Figure 17. -
Follow steps 3-7 in Visualize Streamlines from the Inlet to
position the slice plane near the inlet then press Esc to exit the Move
tool.
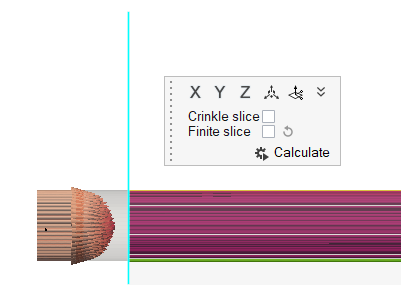
Figure 18. -
Click
 slice plane in the microdialog.
-
Click next to Legend.
-
On the guide bar, click
to execute
the command and exit the tool.
Animate the Slice Plane
- Hide the streamlines from view in the Post Browser.
- Right-click on Slice Plane 1 and select Animate from the context menu.
-
Click on the Animation toolbar.
- Set the number of steps to 100 and choose a desired speed.
-
Click to start the animation.
Save, Export, and Apply States
- From the menu bar, select .
- Choose a destination to save the file, give it a name, then click Save.
The saved state can be imported anytime post is open with the results file (Log file) loaded. To apply a state to a post-processing instance:
- Right-click on top level (Model_Name) folder in the Post Browser and select Apply State from the context menu.
- Browse to the state file on your machine and click Apply to load the state.