Define Curves
Existing curves can be edited individually and new curves can be added to the current plot using the Define Curves panel.
The Define Curves panel also provides access to the program's curve calculator.
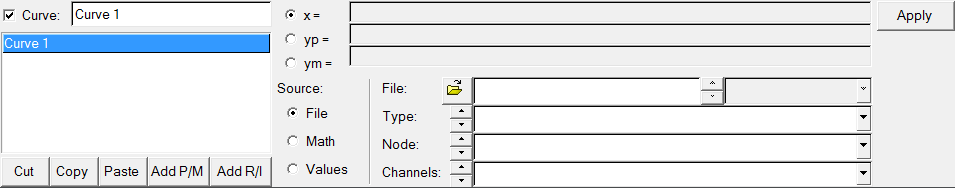
Figure 1. Phase/Magnitude selected

Figure 2. Real/Imaginary selected
Click Add P/M to define Phase and Magnitude curves. Click Add R/I to define Real and Imaginary curves. The y-axis labels change depending on the curve type you select. When you change the curve type, HyperGraph applies the following conversion equations to the plot data:
When converting real/imaginary curves to phase/magnitude curves, the conversion equation is:
y = a+bi
Phase = arctan(b/a)
Magnitude = sqrt(a*a+b*b)
When converting phase/magnitude curves to real/imaginary curves, the conversion equation is:
If *AutoDefaultCurves() is turned on in the preference file and a curve is added to a plot with existing curves, the new curve is a copy of the most recently added existing curve. If *AutoDefaultCurves() is turned off, the new curve is empty.
Data Sources
Complex curves are comprised of an X data vector and a Y and Y2 data vector. The X and Y vectors can be read from a data file, defined as mathematical expressions, or entered as values. The X and Y vectors of a curve do not have to come from the same source. For instance, the data source for the X vector of a curve can be an ASCII file and the source for the Y vector of the same curve can be defined by an expression such as sqrt(x).
File as a Data Source
If File is selected as the source, the file panel is displayed, allowing you to select data files for the X, Y, and Y2 vectors.
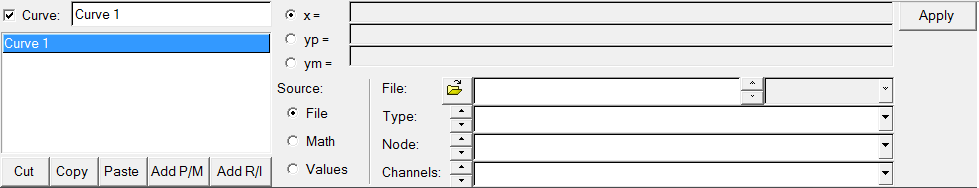
Figure 3. File selected as the data source for a vector
Math as a Data Source
If Math is selected as the source, the curve calculator is displayed, allowing you to define the vector mathematically.
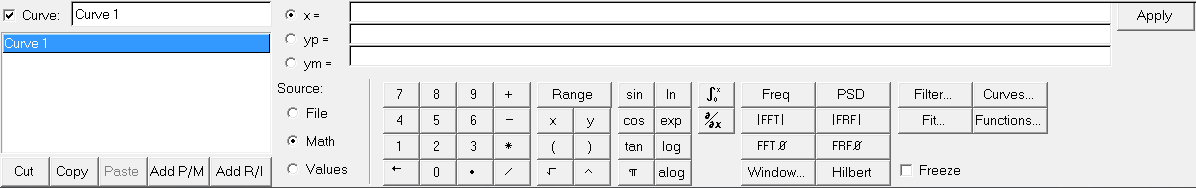
Figure 4. Math selected as the data source for a vector
Values as a Data Source
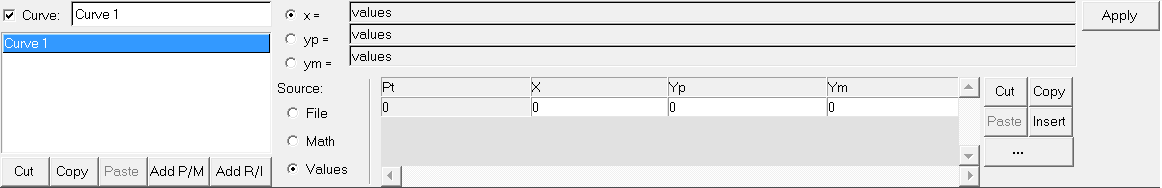
Figure 5. Value selected as the data source for a vector
You can cut, copy, paste, and insert data point values to the table. Click the
expansion button,  , to view
a larger dialog containing all X, Y, and Y2 data points.
, to view
a larger dialog containing all X, Y, and Y2 data points.
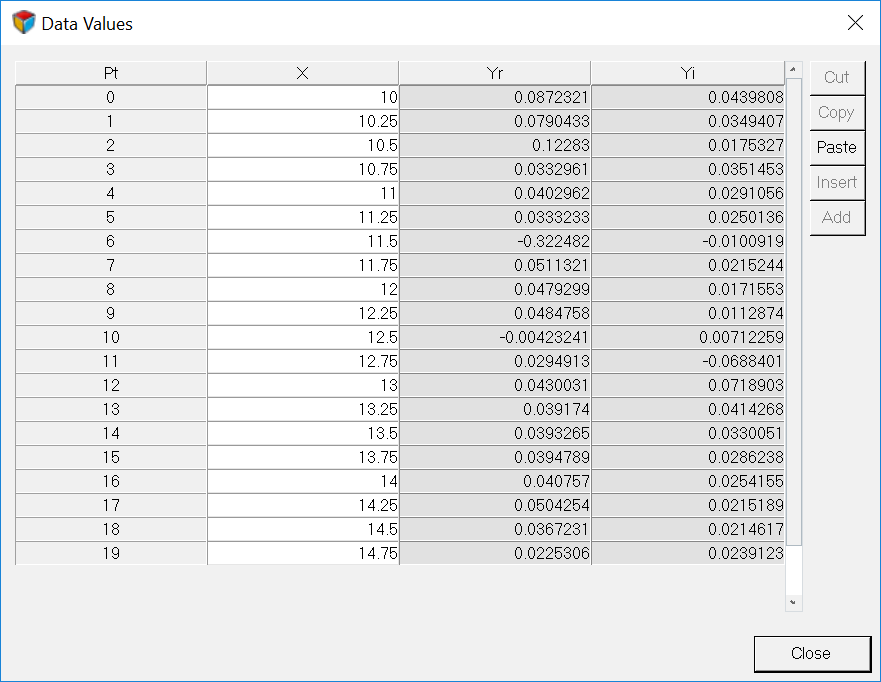
Figure 6.
Curve List
The curve list displays the names of all the curves in the active window.
Individual curves can be turned on or off. To turn a curve off, select the curve from the list or pick the curve from the window and deactivate the check box next to the curve name above the curve list. To turn a curve on that was turned off, activate the check box.
The Cut, Copy, Paste, and Add buttons are used to maintain the curve list for the active window. Curves can be copied and pasted into other windows. Curves can also be added and deleted from the list.
Create and Define Curves
The Define Curves panel enables you to edit existing curves and create new ones. In order to edit a curve, it must first be selected either from the curve list or picked from the window.
If you are creating phase/magnitude curves, the x, yp, and ym vectors are displayed at the top of the Define Curves panel. If you are creating real/imaginary curves, the x, yr, and yi vectors are displayed at the top of the Define Curves panel. The data sources for the X and Y vectors are displayed in the text fields. Click the x, yp, ym, yr, or yi vector radio button or in the corresponding text box to select that vector for editing.
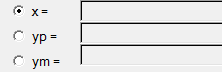
Figure 7. The X and Y vectors on the Define Curves panel. The text field shows the data source for the vector.
New data can be selected from a source file, mathematically defined using the program's curve calculator, or entered as values. The Define Curves panel changes depending on which source is selected.
Referencing Curves
Expressions can reference any curve or vector in the current session.
Curve vector references can be defined by picking the curve with the mouse or by using the following syntax:
pmwnco.vector
where:
m is the number of the page on which the curve resides
n is the number of the window which contains the curve
o is the number of the curve in the window
vector indicates the X, Y, or time vector of the referenced curve
For example, p2w1c3.y references the Y vector (.y) of the third curve (c3), in first window (w1), on the second page (p2).
When a referenced curve is edited or updated, the curves that reference that curve are updated as well.
- Phase Values
- To indicate that a curve references phase values, phase curves have the letter p at the end. For example, pmwnco.vectorp.
- Magnitude Values
- To indicate that a curve references magnitude values, magnitude curves have the letter m at the end. For example, pmwnco.vectorm.
- Real Curves
- Real curves that reference real values have the letter r at the end, pmwnco.vectorr.
- Imaginary Curves
- Imaginary curves that reference imaginary values have the letter i at the end, pmwnco.vectori.