Plot Macros
Allows you to create macros that produce curves and notes for plots.
A plot macro can include either a curve or note, or both a note and a curve. Plot macros can be used to capture and replay frequently used curve operations such as adding two curves together, filtering curves, or filtering and then curve fitting data. They can also be used for frequently used plot notes. Plot macros can be created and edited in the program or loaded automatically by registering them in a preference file.
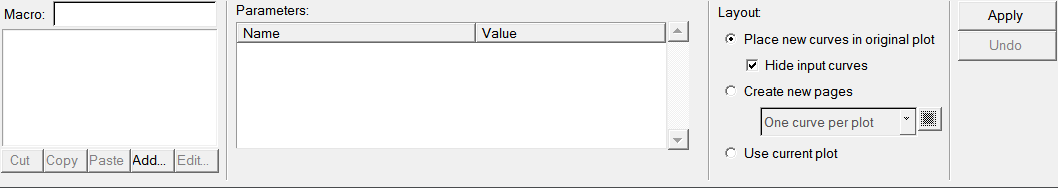
Figure 1.
Macros List and Parameters
All plot macros in the current session are listed in the Macro list.
Macros can be cut, copied, and pasted using the macro list.
The parameters associated with the selected macro are displayed in the Parameters list. Parameters can be either curve or scalar. Curve parameters are displayed as collectors. Click on a collector to graphically select a curve from a plot. Double-click on a collector to display the Select Curve dialog. Scalar parameters are displayed as text boxes. Parameters are usually used to collect curves from within the session to use in mathematical expressions. The result calculation can utilize any math functions, including Templex functions and external functions.
Edit Plot Macros
Allows you to add new plot macros to a session and edit the curves and notes for existing plot macros.
- Parameters
- Add parameters for plots and notes.
- Curve
- Add or edit a plot macro curve.
- Note
- Add or edit a plot macro note. Notes can be attached to windows, views, existing curves, coordinates, and curves created by the macro.
Layout
Under Layout, you can control the placement of the resulting curves with the following options.
- Place new curves in original plots
- Inserts the resultant curve(s) in original plots. The created curves are associated to the original curve's axis.
- Hide input curves
- Original curve(s) are hidden but not deleted.
- Create new pages
- Places resultant curve(s) on a new page. When creating curves from the Plot Macros panel, the created curves are associated to the same axis as the selected curves.
- Use current plot
- Places all resultant curve(s) in current plot.
Click Apply to apply a plot macro. The plot macro uses the parameters to create curves and notes within the session.
Undo reverses the plot macro.