Display Custom Plot Types
-
Right-click in the Bar Chart plot window and select Pie
Chart from the Custom Rendering menu.
The Gauge and Pie Chart plot types support most XY and bar chart plot type features, such as max/min, fixed or scientific notation, datum lines (red and yellow only), fonts, syntax, and more.
Gauge is designed for the first curve only in a window, while Pie Chart is designed for only a single catalog in a window.
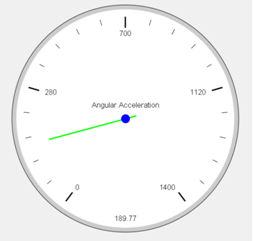
Figure 1. Gauge plots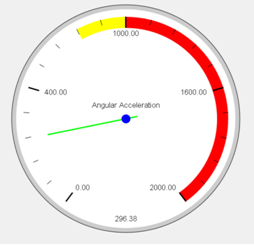
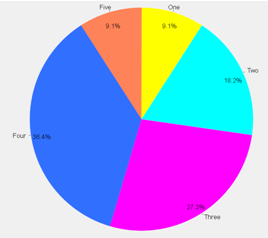
Figure 2. Pie chart