Mouse Over Curve and Data Point Highlighting
HyperGraph contains enhanced functionality for displaying curves, thereby improving a curve's visibility and usability.
The enhanced features include:
- Inspect mode, which increases the screen area of the plot.
- Pre-highlighting of plot attributes (curves, legends, axes, and headers/footers) in gold when you move the mouse pointer over them.
- Displaying data point markers on a pre-highlighted curve.
- Highlighting curves when selected from the Plot Browser, even when the curve is not in the active window. You can select one curve only from the Plot Browser or multiple curves; either way they are highlighted in gold in the plot(s).
- Larger font sizes for axes titles and tic numbers.
This functionality is on by default, and can be enabled/disabled from the . The curve and pre-highlighting features are detailed below.
- Behavior/Entity Affected
- Description
- Inspect
- Double-clicking on an empty space in the plot (not on an entity) increases the
screen area of the plot by hiding the panels and any other windows on the
page. If the plot was part of a multi-window layout, the other windows are
also hidden so that the entire plot area is available for the plot that you
selected.When a curve is clicked in Inspect mode, the following behavior is displayed:
- The curve reverts back to its specified curve color, and all other curves in the plot fade out.
- Circular markers appear at the curve's data points. The other curves on the plot are hidden, or fade into the background.
- The legend only displays the selected curve and only the axes associated with the curve is displayed.
- When you hover the mouse pointer over a data point on a curve, the data point coordinates are displayed in a temporary note.
- When you move the mouse pointer over a non-highlighted curve, the curve is pre-highlighted in its original color, instead of the standard gold pre-highlighting color.
- Double-click on a curve to highlight the curve in the browser.
Clicking anywhere in an empty space in the plot while a curve is isolated causes the rest of the curves in the plot, as well as the axes, to once again be visible in the plot and the legend.
To turn off the Inspect mode, double-click anywhere in the plot (but not on the curve) to return the window to its normal state.Note: While pre-highlighting is available in all HyperGraph plot types (XY Plot, Bar Chart, Complex Plot, and Polar Plot), Inspect is only available for XY Plot and Complex Plot.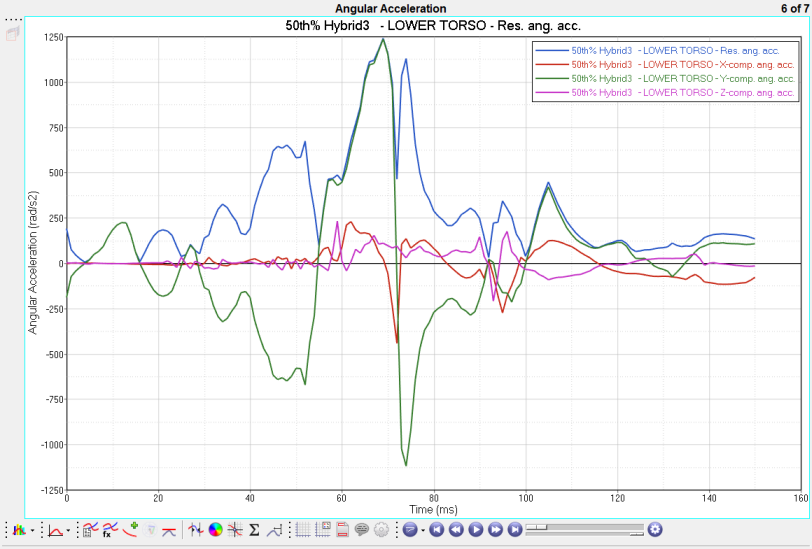
Figure 1. Plot with Inspect mode enabled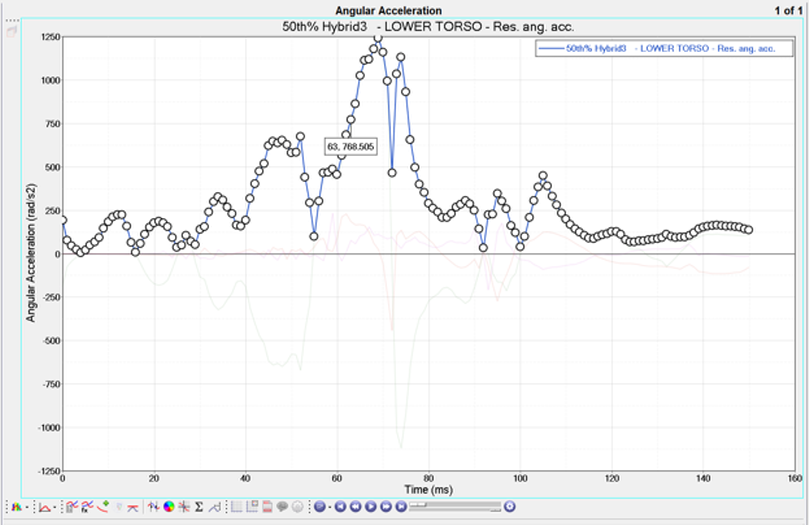
Figure 2. Plot with Inspect mode enabled, with a curve selected.Note: Notice the visible data points, temporary pop-up note, reduced legend size, and faded out curves in the background. - Pre-highlighting of Plot Attributes
- Plot attributes such as curves, axes, legends, and headers/footers can be
pre-highlighted by passing the mouse pointer over the entity.
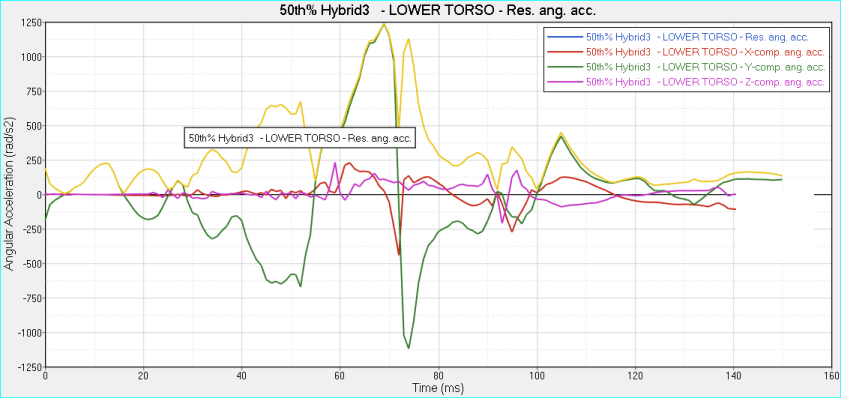
Figure 3. A pre-highlighted curve, with the curve name displayed in a temporary note.
Figure 4. A pre-highlighted axis.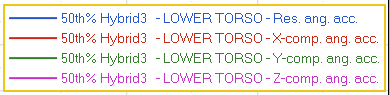
Figure 5. The pre-highlighted legend is surrounded in a gold border.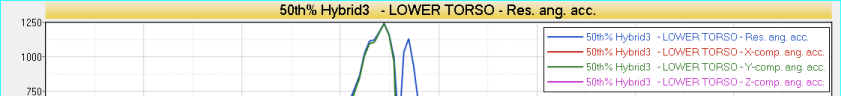
Figure 6. Headers and footers can also be pre-highlighted. - Data Point Markers
- Circular markers are displayed at the curve’s data points when a curve is selected while in Inspect mode. If data points are so close together that the markers overlap by a distance more than 50% of the radius of the markers, only the circular marker closest to the mouse pointer the will be shown.
- When you hover the cursor over a data point on the selected curve, a
temporary note is attached to the curve at that point, displaying the
coordinates of that data point.
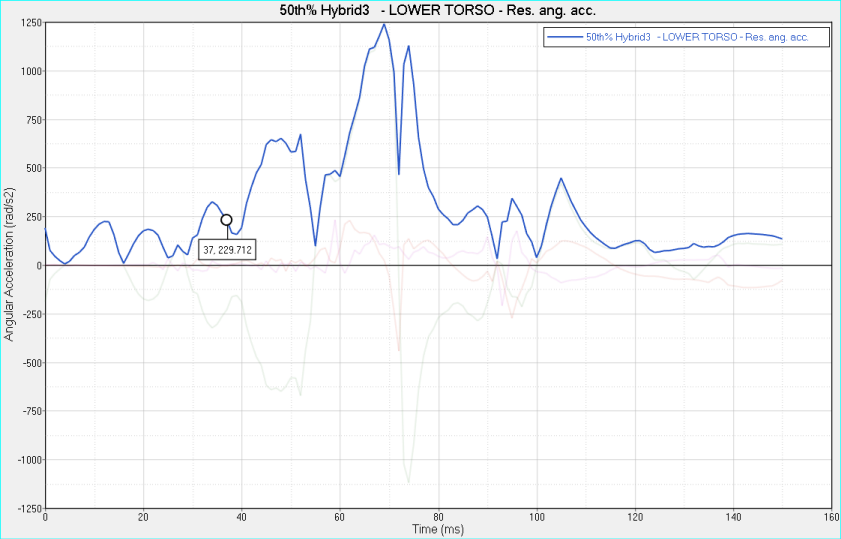
Figure 7. - Legend
- While in Inspect mode and when selecting a curve, the legend is updated to show only the selected curve.
-
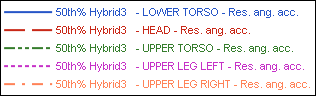
Figure 8. The legend while in Inspect mode, but without selecting a curve:
Figure 9. The legend while in Inspect mode, and with a curve selected: - Axes
- Only the axes associated with the highlighted curve are displayed (any secondary/tertiary axes not associated with the highlighted curve are hidden).
-
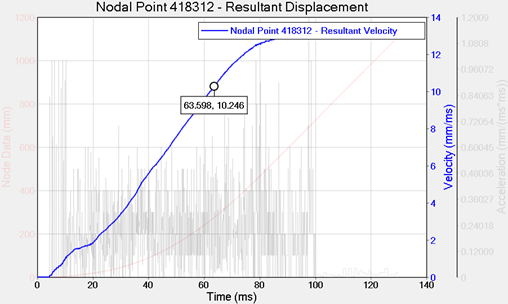
Figure 10.
Figure 11. Passing the mouse pointer over the axes pre-highlights it. - Animations
- Beginning in HyperGraph version 14.0, animations are visible when plotting curves and zooming/panning.
- Legacy Sessions
- Loading a legacy session results in HyperGraph displaying the pre-14.0 GUI appearance (frame color, axis fonts, gridlines, and so on), but still featuring the new behavior associated with prehighlighted curves and data point markers.