Integrity Post Processing
Check the integrity of data.
Check Integrity of Data
Review a series of statistical measures on input variables and output responses in the Integrity post processing tab.
- From the Post Processing step, click the Integrity tab.
-
From the Channel selector, select a category of information to display in the
table.
- Health: High level summary of statistics used to easily spot inconsistent, non-changing, or missing data.
- Summary: Basic descriptive statistics that presents information on the data in groups such as quartiles or ranges.
- Distribution: Detailed descriptive statistics used to quantitatively describe the distribution of data points.
- Quality: Values typically used in Quality Engineering.
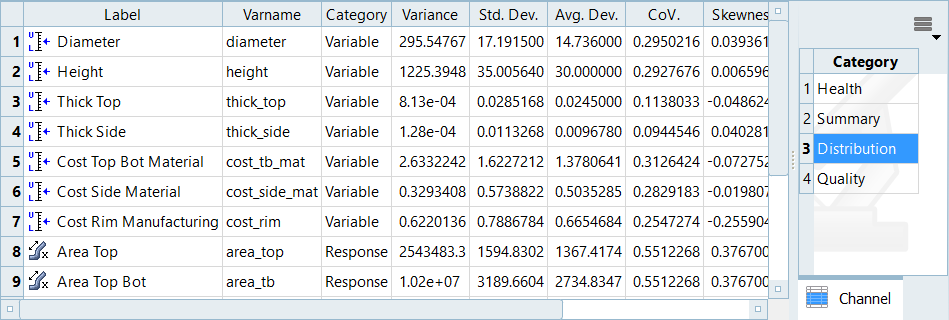
Figure 1.
Integrity Tab Data
Each column in the Integrity tab displays a statistical indicator for output responses.
- Column
- Description
- Avg Dev (Average Deviation)
- Average deviation is evaluated using:In Figure 2, the horizontal line represents the
average of the values in the vector. The vertical lines represent the
differences between the values of the vector and the average of the
values. The average deviation is the average difference between the
vector elements and the average of the vector elements. The sign of each
element is not taken into consideration when calculating the deviation.
The sign of each element is taken into consideration when calculating
the average of the elements.
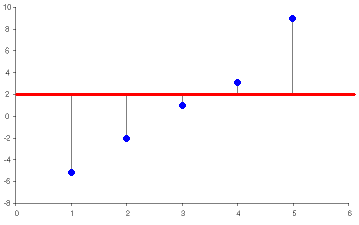
Figure 2. - CoV (Coefficient of Variation)
- Measure of the relative dispersion given by:
- Kurtosis
- Measure of the flatness of a distribution.
- LCL (Lower Control Limit)
- Mean - 3*standard_deviation
- Maximum
- The largest of all output response values.
- Mean
- The most probable value the output response would take.
- Median
- The median of a scalar is that value itself.
- Minimum
- The smallest of all output response values.
- Outliers
- Outliers are data points that fall outside the whiskers of a box plot. To learn more about outliers, refer to About Box Plots.
- RMS
- The square root of the mean of the sum of the squares of all output response values is calculated using:
- Skewness
- Indicates whether the probability distribution is skewed to the right or to the left. If the skewness is zero, the probability distribution is symmetric about the mean of the distribution. If the skewness is less than zero, the probability distribution is skewed to the left of the mean of the distribution. If the skewness is greater than zero, the probability distribution is skewed to the right of the mean of the distribution.
- Standard Deviation
- Square root of the variance.
- UCL (Upper Control Limit)
- Mean + 3*standard_deviation
- Variance
- Evaluated using: