Ordination Post Processing
Visualize dimension reduction.
Visualize Dimension Reduction
Analyze a biplot from a Principle Component Analysis (PCA) in the Ordination post processing tab. The PCA transforms the source data into different coordinate systems known as the principal coordinates.
Principle coordinates are ordered in terms of decreasing contribution to the data’s overall variance; this means that trends in the data can typically be observed by looking at only the first few principal coordinates.
Data is represented as scatter points. Each input variable and output response in the biplot is represented by a line. The relative angle and the angle between lines can be interpreted to determine which are correlated. Lines that point in the same direction have strong correlations (positive or negative depending on whether the lines point in the same or opposite directions). The relative length of the lines also indicates a strong correlation.
-
Using the Channel selector, select the principle components to plot.
Tip: For the Y Principle Component, multiple components can be selected. Display selected data in a single plot or separate plots by switching the Multiplot option between
 (single plot) and
 (multiple
plots).
(multiple
plots).
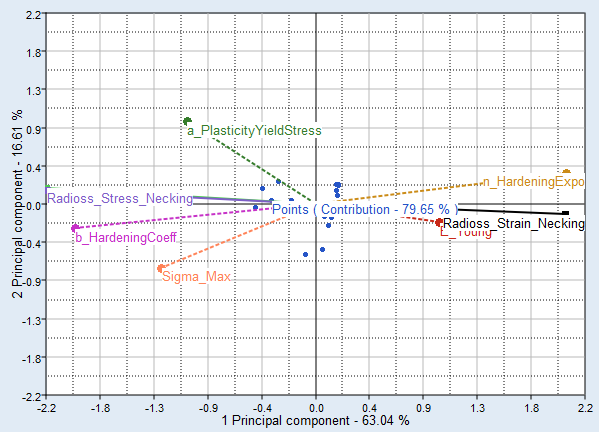
Figure 1.
Ordination Tab Settings
Settings to configure the plots displayed in the Ordination post processing tab.
- Labels
- Show labels in the biplot.
- Points
- Show scatter points in the biplot.
- Legend
- Show legend in the biplot.