View Porosity Analysis Results
Use to view the results of a porosity analysis. You can view shrinkage percentage, temperature evolution, solid fraction, and solidification times for a selected run and load case.
-
Click the Show Porosity Analysis Results tool on the
Porosity icon.
 The Analysis Explorer opens.
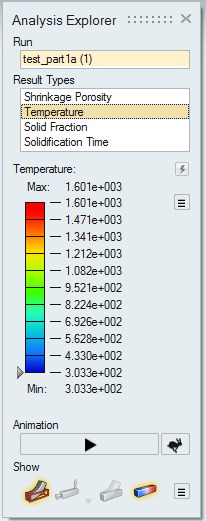
-
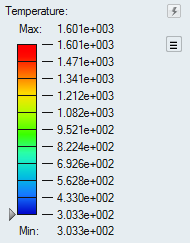
Use the scalable results slider to provide a color gradient for the selected
result type.
- To change the upper or lower bound for the results slider, click on the
bound and enter a new value. Click the reset
 button to
restore the default values.
button to
restore the default values. - To filter the results so that areas on the model with results greater than a specified value are masked, click and drag the arrow on the results slider.
- To change the legend color for the result type, click the
 icon next to
the results slider and select Legend Colors.
icon next to
the results slider and select Legend Colors. - To apply the min/max values for the current result type to all load
cases, click the icon next to the results slider and select
Apply current min/max to all load cases.
- To reset the min/max values for the current result types for all load
cases, click the icon next to the results slider and select
Reset min/max of all load cases.
- To change the upper or lower bound for the results slider, click on the
bound and enter a new value. Click the reset
-
Use the icons under Show to determine what is made
visible in the modeling window for the analysis.
 Show/hide the initial shape as a reference.
 Show/hide loads and supports. You can also show only the current loads
and supports.
Show/hide loads and supports. You can also show only the current loads
and supports. Show/hide the deformed shape as a reference.
 Show/hide contours. Click the icon to reveal additional options related
to contours. Select Interpolate during animation to
animate the result contour. Select Blended contours
to toggle between blended and nonblended contours.
Show/hide contours. Click the icon to reveal additional options related
to contours. Select Interpolate during animation to
animate the result contour. Select Blended contours
to toggle between blended and nonblended contours.