Plot Motion Results
If you've previously run a motion analysis, use the Review Motion Results tool on the Analyze icon to plot the results. You can export the plot in .csv format. For parts, you can also export loads.
Location: Motion ribbon, Run group, Analyze icon
Plotting Results
After running a motion analysis, select an object to plot in the modeling window.
-
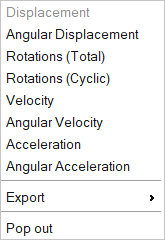
Right-click on the plot to see a list of available motion analysis results that
can be plotted for the selected entity. (The list of options will change based
on the type of entity selected.)
-
Right-click and mouse through the check mark to exit, or double-right-click.
Tip:
- If you make a change to the model that requires running a
reanalysis, the check icon
 disappears, and
you will not be able to review or plot results until you run another
motion analysis.
disappears, and
you will not be able to review or plot results until you run another
motion analysis. - Click near the border of a callout plot and drag to reposition it.
- Click on empty space to dismiss the callout plot.
- Use the Ctrl key while selecting an item to go directly to a pop-out plot.
- If you add a measure after running motion analysis, you'll need to rerun the analysis before you can make a plot for that measure.
- If you make a change to the model that requires running a
reanalysis, the check icon
Pop-Out Plots
Double-click a plot to open an interactive plot in a resizeable, dockable window.
Pop-out plots allow you to view multiple plots at the same time. Double-click the title bar to dock or undock the plot.
- Animate the results in the modeling window by dragging the vertical time slider.
- Interrogate values on curves by viewing (x,y) coordinates on mouse hover.
- Hide curves by clicking the associated icon in the legend.
- Zoom, pan, and fit the plot in the window. When zooming, use the Ctrl key to keep the x-axis fixed. Press F or double-click in the plot area to fit the plot.
Plot Manager
Use the Plot Manager to browse and plot motion results data, create cross plots (data vs. data), define pages in different layouts, and save the plots you've defined as a template for reuse.
You can access the Plot Manager by clicking the Plot Manager icon on the motion animation toolbar.

The Plot Manager window is dockable, and you can search and filter results on both the Plot and Edit tabs. Specific features include:
Plotting
Use the Plot tab to select which motion analysis results to show on the plot.
- Quickly generate plots in the default Surf mode. Surfing allows you to quickly browse your results. Alternatively, you can turn surfing off and simply use the Apply button to plot specific components.
- Click Apply to commit the curves to the plot. Make sure to choose data of the same type on the Y axis. If you see an asterisk next to the legend label, it means that result has not been committed to the plot.
- Click the Clear button to remove all results from the plot.
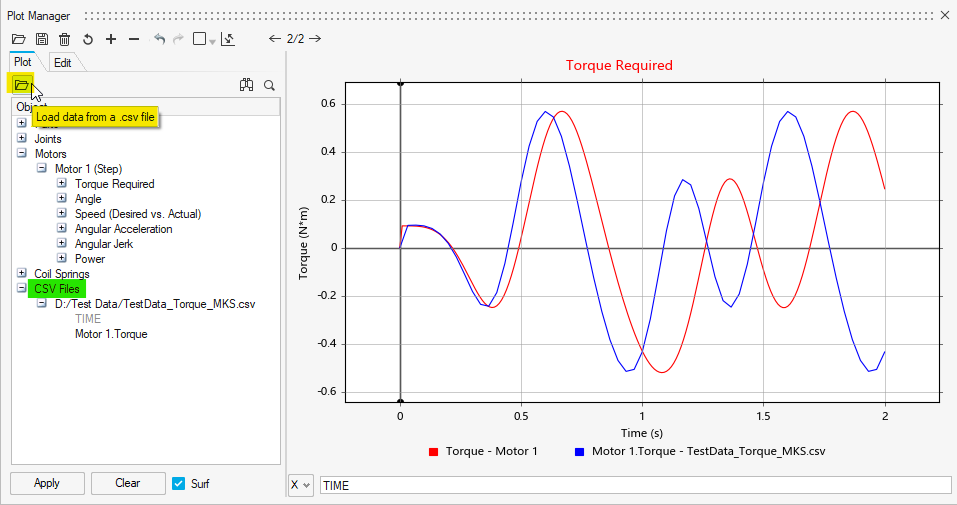
- The Plot Manager also allows you to load data from a .csv file that you can then
plot alongside your motion analysis results. This is useful for comparing
results to test data or to overlay results from a different model or analysis.
To use this feature, click the folder icon underneath the Plot tab to load your
data, and then plot the data channels from the CSV Files
container in the plot browser tree.
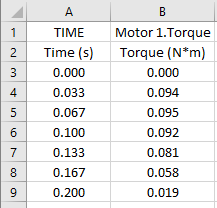
- When importing .csv data, specify the units in the column headers, as shown
here:
Creating Pages
Use the icons at the top of the Plot Manager to mange plot templates and pages. You can:
- Import and save plots
 as
templates.
as
templates. - Delete all pages
 and restore a single blank page.
 - Load a saved
 template.
 - Create and delete
 plot
pages.
plot
pages. - Undo (Ctrl + Z) or redo (Ctrl + Y)
 the last operation.
 - Change the layout of the plots
 on the
pages.
on the
pages. - Swap the X and Y axes for the active plot
 .
. - Step through the pages using the arrow buttons
 .
.
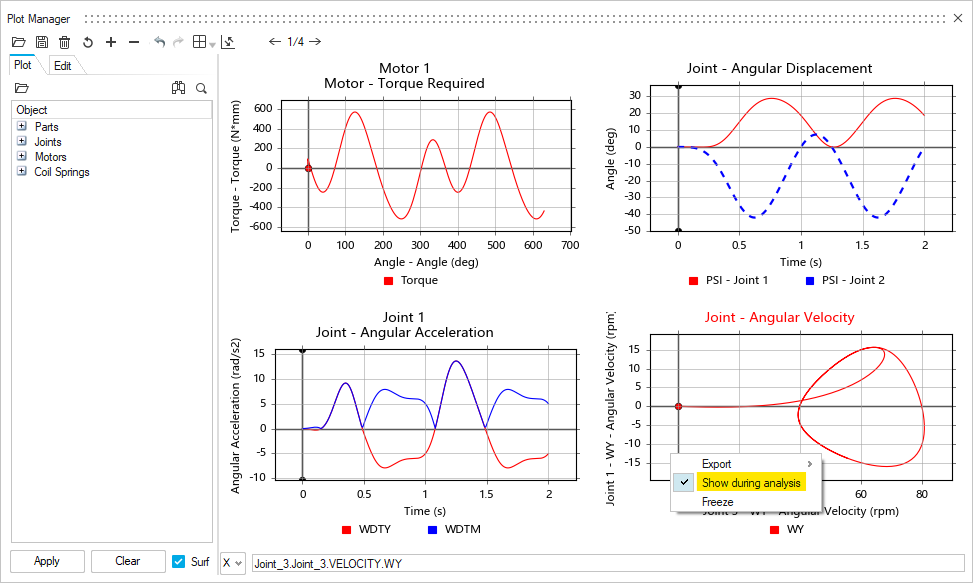
Note that the currently active plot is shown with a red title.
Creating Cross Plots
The X-axis uses time by default, but you can also plot data vs. data (cross plots).
- When plotting vs. time, there is a vertical time line that is draggable and is linked to the animation.
- Click
 to plot
data vs. data.
to plot
data vs. data. - When cross plotting, you'll see a time bubble instead of a time line.
Editing Plots
Use the Edit tab to change attributes of the plot, including:
- Curve properties such as line thickness, line style, color, etc.
- Plot title
- Axis labels
- Axis limits
When in the Edit tab, you can also replace a curve using the right-click context menu.
Tips
- To plot the same result for several components at the same time,
Ctrl+click to select multiple objects, right-click,
and then select the desired result type from the context menu.Important: The result being plotted must be an output that is common between all selected objects.
- When the Plot Manager is open, you can select an object in the modeling window or Model Browser to plot results.
- To populate the first page of the Plot Manager with data from a callout plot:
- Select an object in the modeling window. A small callout plot will appear.
- On the motion animation toolbar, click Plot
Manager
 .
.
- To create a two-line plot title, click the title to edit it and press Enter after the first line. Changes can be finalized by pressing Shift+Enter or by clicking outside the entry dialog.
- If the Load Saved Template icon is grayed out, it means there isn't a plot
template file with a name that matches your model name in the standard templates
location ...\Documents\Altair\Inspire\MotionPlotTemplates.
- If you have forgotten to manually save your changes, look for the last auto-saved version at this location: ...\Documents\Altair\Inspire\MotionPlotTemplates\autosave.
Live Plots
Plots of motion results update live while solving, and will appear when you click on entities in the Model Browser or if an entity is selected in the graphics window.
If you create or author a plot using the Plot Manager, you can use the Show during analysis option to show it live during the motion analysis. This also works for cross plots where the x-axis is not Time.
The live plot will remain displayed between runs until you manually close the plot.
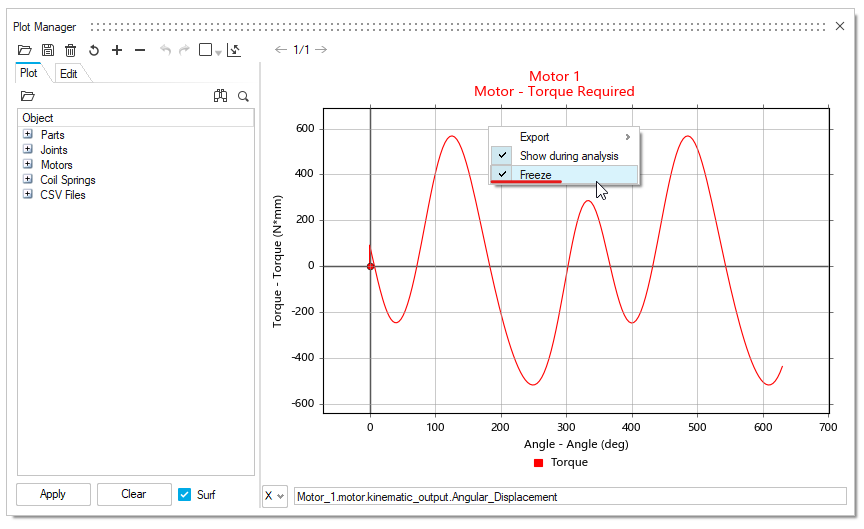
Freeze for Overlay Plotting
You can freeze a plot to allow results comparisons between different runs using right-click context menu in the Plot Manager.
Enabling the Freeze option on an authored plot specifies that after the next run, a copy of the newly plotted curve will be automatically generated at the end of the motion analysis. This frozen copy of the curve will persist on the plot during each subsequent analysis, allowing you to compare motion runs.
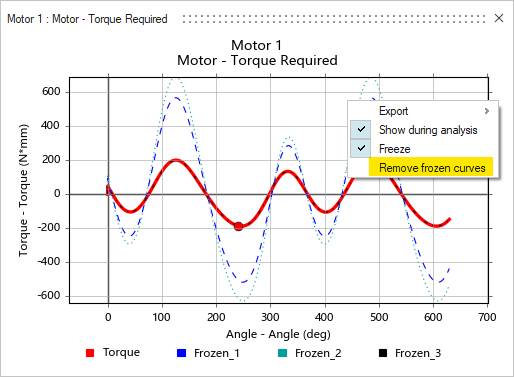
This feature works best when used in combination with the Show during analysis option, which creates a persistent live plot. It allows you to compare changes against frozen curves from prior runs without needing to invoke the Plot Manager after each motion analysis.
The Remove frozen curves option is a convenient way of deleting all of the frozen curves at once, and is available from the context menu on a live plot when reviewing motion results.
Shortcuts
| To | Do this |
|---|---|
| Choose what can be plotted/exported | Right-click on the chart. |
| Pop out a plot (interactive) | Press Ctrl and click an object. |
| Pan the plot (interactive) | Right-click and drag. |
| Zoom in the plot (interactive) | Press Ctrl + scroll to keep the x-axis fixed (zoom y). Press Shift + scroll to keep the y-axis fixed (zoom x). |
| Fit the plot (interactive) | Press F or double-click in the plot area. |
| Cycle through plots using the Model Browser or Plot Manager browser | Use the Up/Down arrow keys to traverse the entities in the browser. |
| Cycle through plot pages in the Plot Manager | Use the Page Up/Page Down keys to traverse plot pages. |
| Exit the tool | Right-click and mouse through the check mark to exit, or double-right-click. |