View Cuts by Frequency
This kind of plot can be used to compare the amplitude measurements made by the simulation process for a particular component, step, order, antenna, cut and point in the sweep, against a simulation frequency. This option is useful when the user has selected a frequency sweep in the Simulation Parameters, in order to inspect how the measurements for a particular observation point change through a frequency sweep.
When this option is chosen from the menu, the panel presented in the figure below will appear.
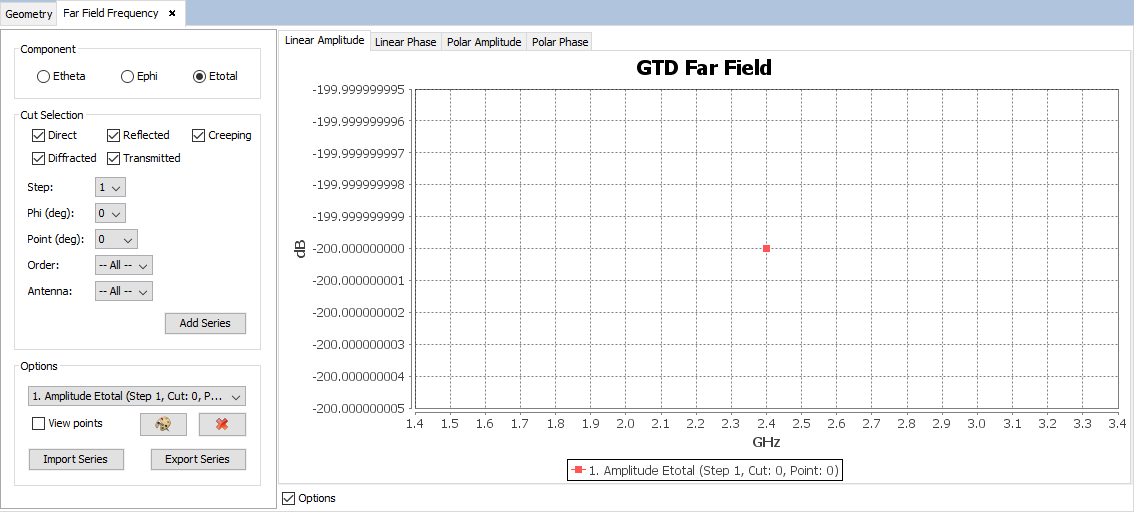
Figure 1. View cuts by frequency panel
Similar to the behavior of the standard Far Field chart, this panel displays a plot with the results and several options for adding and removing extra series from the plot.
When initially open, the panel will display a default series in the plot that will represent the measurements for a particular component, step, and observation point, against every possible frequency and antenna that has been simulated. More series can be added, by selecting a component, step and spherical coordinates in the control panel that appears on the left side of the plot.
-
Component: the results may be plotted using different
polarization and its components:
- Lineal: Etheta, Ephi, Etotal components.
- Gain (dBi): Theta Gain, Phi Gain, Total Gain components
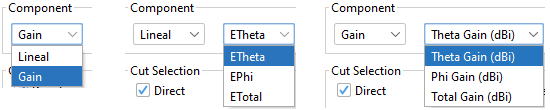
Figure 2. Component group - Step: the parametric step to select. These should have been defined prior to the calculation when designing the simulation.
- Frequency: frequencies that have been simulated.
- Point: select a particular observation point.
- Order: select a particular order.
- Antenna: select a particular antenna.
The selected series can be added to the plot by pressing the Add Series button. It is also possible to modify the look and delete series previously added to the chart. You can change the color of a particular series by selecting it in the list and pressing the Change Colors. To remove a series from the plot representation, click on the Remove series button.
Series can be imported and exported. To save a series click on the Export series button. Later it is possible to load previously exported series by pressing the Import Series button and locating the file where the results were saved in.