


|
MongoDB
The MongoDB connector is an interface used to import MongoDB’s schema-less BSON documents into a table schema that Panopticon can interpret and analyze. It uses many BSON structure types and MongoDB query features.
Steps:
1. Select MongoDB from the Data Sources pane. The MongoDB Settings pane and the retrieved MongoDB source are displayed.
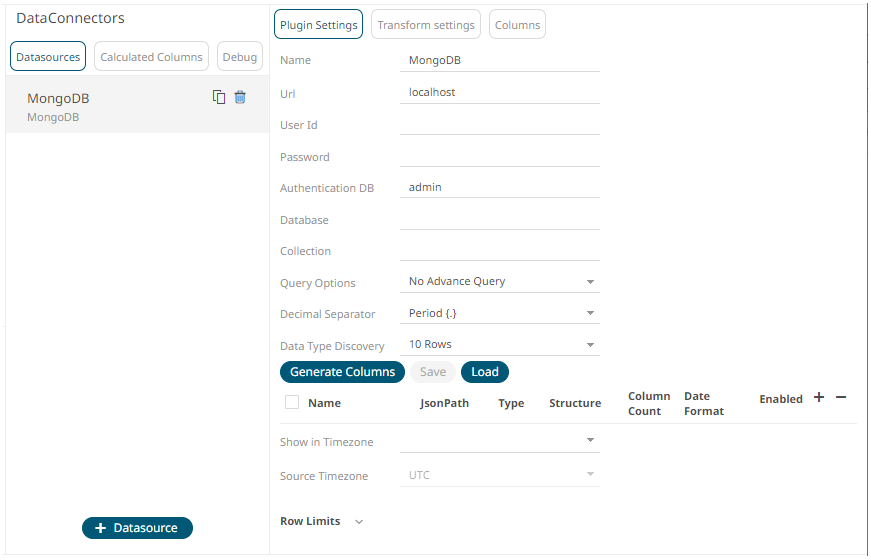
2. Enter the Name of the MongoDB
data source, then click  .
.
3. Enter the following properties:
|
Property |
Description |
|
URL |
Enter either: · localhost if the database resides on the same computer, or · enter the IP address and port of the computer where MongoDB is installed (e.g., 192.168.1.1:27017). If no port is specified, the default is 27017. |
|
User Id |
The user Id if authorization is enabled for MongoDB. |
|
Password |
The password if authorization is enabled for MongoDB. |
|
Authentication DB |
The database where the user is created (default is admin). |
|
Database |
The database that will be used. |
|
Collection |
The collection that will be used. |
You can also opt to make the Query Document feature of MongoDB to be available in Panopticon.
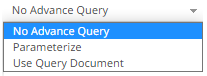
Select Use Query Document in the Query Options drop-down list.
This also displays the Method drop-down. Select either Find (Default) or Aggregate.
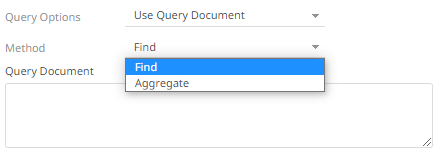
When Aggregate is selected, you can add all the columns generated by aggregation in the schema.
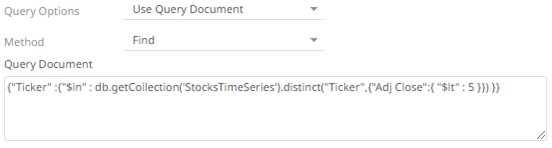
In addition, the MongoDB command line interface displays query operations with a JSON style syntax.
Enter your desired JSON query document. Refer to http://docs.mongodb.org/manual/tutorial/query-documents/ for more information on the Query Documents feature on MongoDB.
For example:
Queries from the documentation look like this: db.inventory.find ( {type: "snacks"} ). The database and collection are already defined in the UI and the Find operation is handled in the code. The user only needs to enter the query document:
{ type : "snacks" }
For more advanced query, it must include surrounding curly braces as well as matching internal braces.
5. Instead of using Use Query Document, select the Parameterize query option.
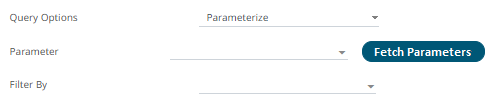
Click Fetch Parameters to populate the Parameter drop-down and select a value. Then select what column to filter on in the Filter By drop-down.
6. Select either the dot (.) or comma (,) as the Decimal Separator.
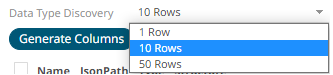
7. Select
the Data Type Discovery.
This property specifies how many rows to fetch from the input data
source, when auto generating the schema after clicking  .
.
8. You can also opt to load or save a copy of the column definition.
9. Click ![]() . A new row displays in the JSON list
box. Enter the necessary information for each column.
. A new row displays in the JSON list
box. Enter the necessary information for each column.
|
Property |
Description |
|
Name |
The column name of the source schema. NOTE: It is recommended to name the column the same as its JSON path for clarity and uniformity. |
|
JsonPath |
The JsonPath of the source schema. |
|
Type |
The data type of the column. Can be a Text, Numeric, or Time |
|
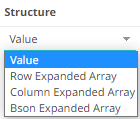
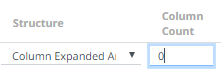
Structure |
Used for more advanced features and are covered in the Row-Wise Array Expansion, Column-Wise Array Expansion, and Bson-Wise Array Expansion sections. Value is the default structure and will always display data regardless of actual structure.
|
|
Column Count |
Enabled when Column-Expanded Array structure is selected.
Enter the number of columns for the plugin to generate as columns for that array. |
|
Date Format |
The format when the data type is Time. NOTE: To parse and format times with higher than millisecond precision, the format string needs to end with a period followed by sequence of upper case S. There can be no additional characters following them. For example: yyyy-MM-dd HH:mm:ss.SSSSSS |
|
Enabled |
Determines whether the message field should be processed. |
To
delete a column, check its  or all the column entries, check
the topmost ,
then click
or all the column entries, check
the topmost ,
then click  .
.
10. Date/Time values of output data and Date/Time inputs, where supported, is by default unchanged.
You can opt to define the Show in Timezone and Source Timezone settings.
11. Set the row limit of the data set.
12. Tap the Preview Selected Data Source slider to turn it on.
13. Click  to display the data preview.