Test No. VNL06Find elastic core and maximum
displacements in a cantilever beam loaded with a moment.
Definition
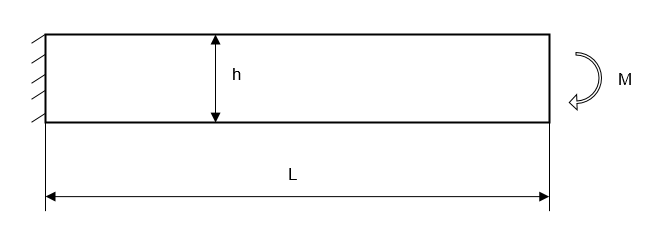
Figure 1.
Beam dimensions are b x h x L.
Where,
Dimension
Value
b
=10 mm
h
=40 mm
L
=200 mm
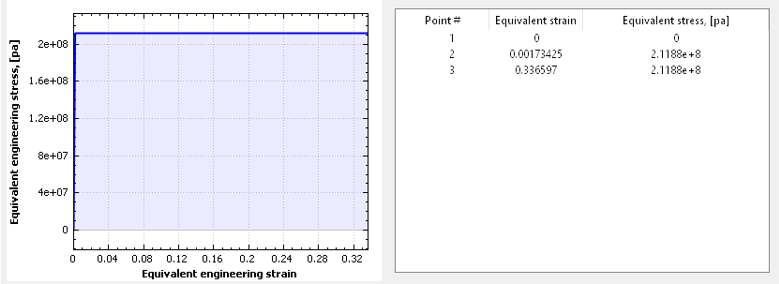
Material of the beam is rigid plastic with the strain-stress curve (Figure 2). Figure 2.
The material properties are:
Properties
Value
Yield stress
= 2.1188e+8 Pa
Yield strain
= 1.73425e-3
Poisson's Ratio
0
The study was performed for the following moment values: 776.893 N*m and 847.518 N*m
Reference Solution
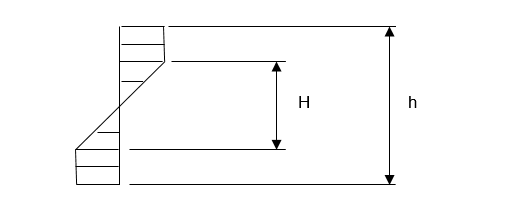
Plastic beam bending theory assumes that there are two zones in the beam material:
plastic zone at the outer layers of the beam and elastic core at the beam
centerline. Figure 3. Corresponding stress distribution for material
without hardening
The relation between applied moment and the size of the elastic core in the beam.(1)
Where, is the beam thickness.
Maximum deflection:(2)
Results
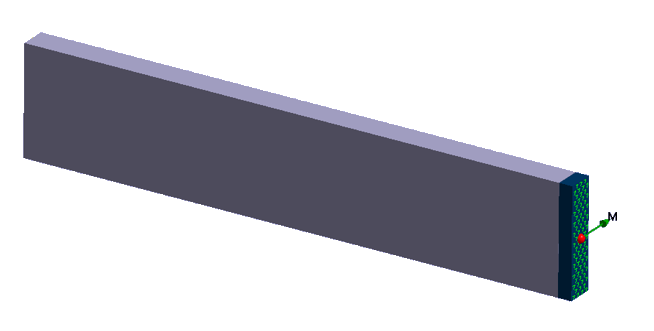
The theory of bending of plastic beams is based on
hypothesis of flat cross-sections which remain flat during deformations. In order to
emulate this basic assumption as close as possible the problem was modeled as an
assembly of two solids. One solid represented the beam itself with material
properties defined by the curve (Figure 2). Another small solid was
attached to the beam end and was set as an absolutely rigid body (Figure 4). The rigid solid was loaded with the
moment and it served as a moment transfer element. Figure 4.
The following tables summarize the simulation results which are
depicted in the figures below.
Moment M [N*m]
SOL Reference, Elastic Core
Size [mm]
SimSolid, Approximate Elastic Core Size
[mm]
% Difference
776.893
10.0
12.0
20.00%
847.518
5.0
6.0
20.00%
Moment M [N*m]
SOL Reference, Maximum
Displacement [mm]
SimSolid, Maximum Displacement
[mm]
% Difference
776.893
3.468
3.351
-3.37%
847.518
6.937
6.918
-0.27%
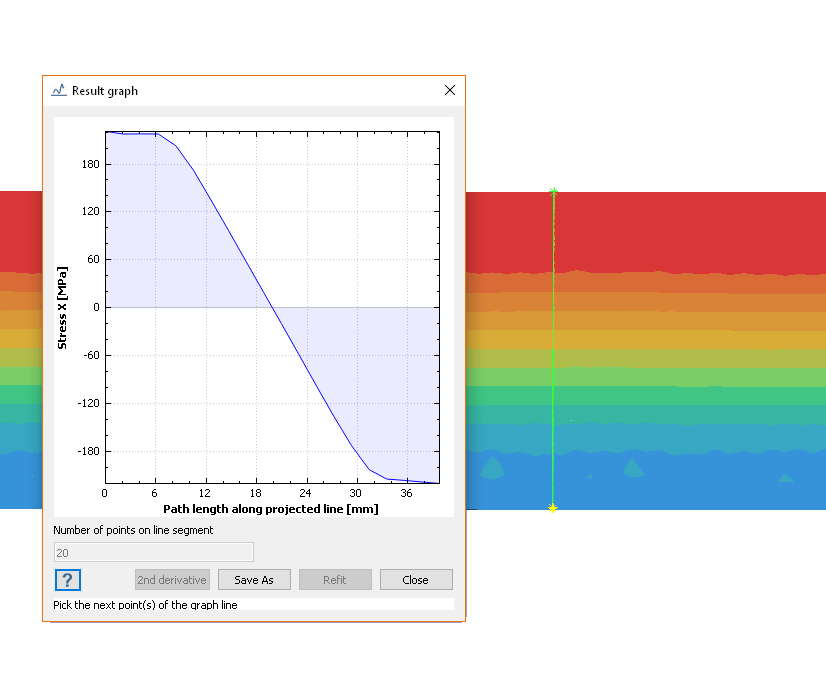
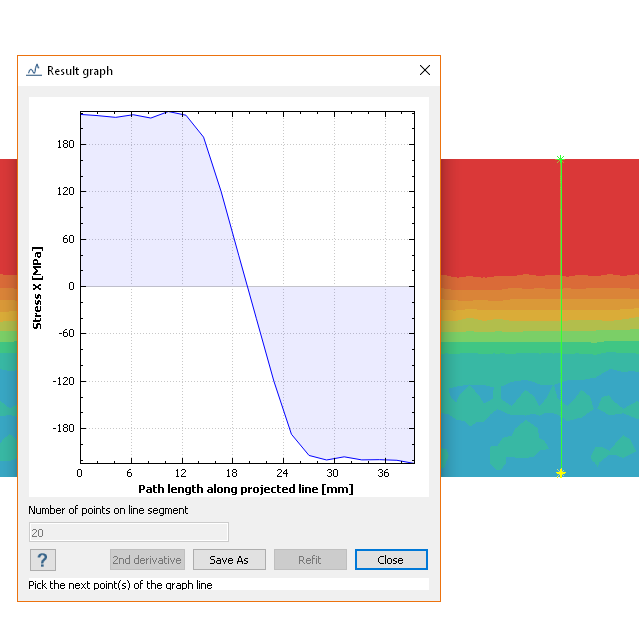
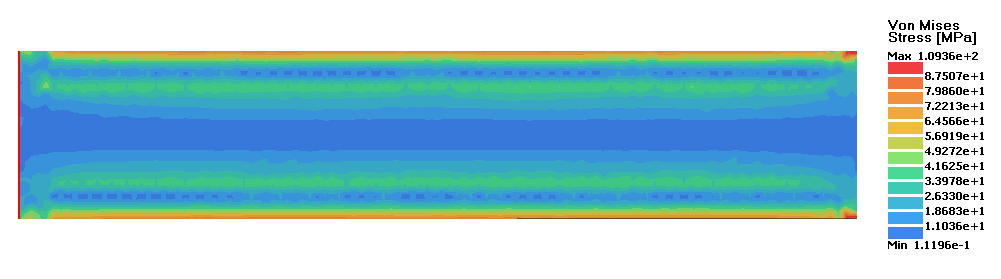
It should be mentioned that SimSolid 3D
solution does not have sharp boundary between elastic and plastic zones as it is in
simplified beam bending formulations. This makes difficult direct comparison;
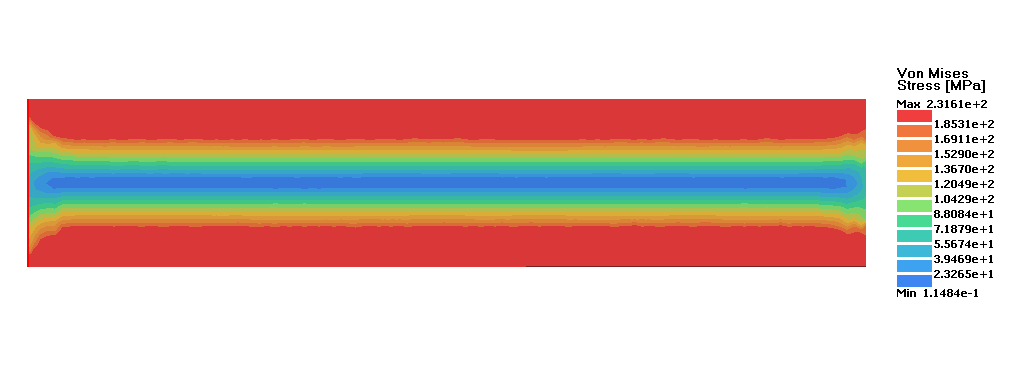
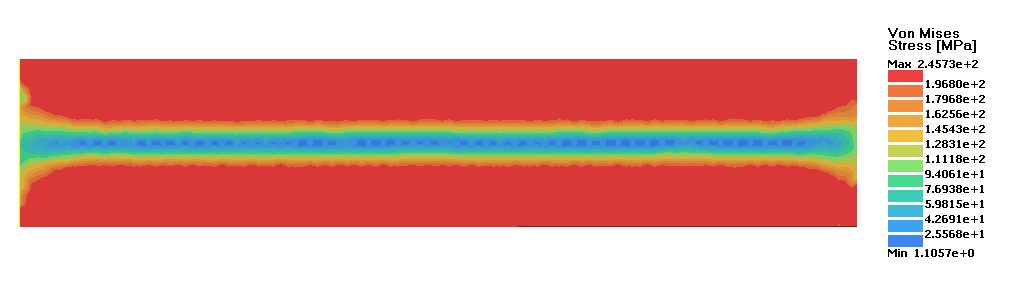
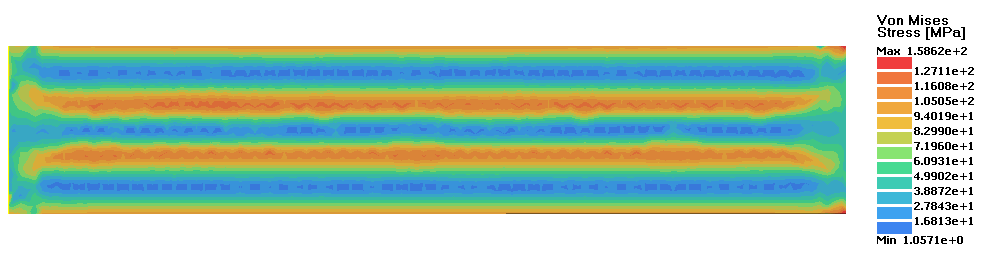
however, the elastic zone approximate sizes are in good correlation. Figure 5. Stress X at M=776.893 N*m Figure 6. Stress X at M=847.518 N*m Figure 7. von Mises stress at M=776.893 N*m Figure 8. von Mises stress at M=847.518 N*m Figure 9. Residual von Mises stress after unloading at
M=776.893 N*m Figure 10. Residual von Mises stress after unloading at
M=847.518 N*m
1 Mase,
George E.,“Theory and Problems of Continuum Mechanics”, McGraw-Hill Company, New
York, 1970