View Data Points
Use this option to show and hide the data points on the plot.
-
Click
 > Show Data Points.
The plot displays the data points. Coordinates of the points on the plot is displayed when the cursor is placed on them.
> Show Data Points.
The plot displays the data points. Coordinates of the points on the plot is displayed when the cursor is placed on them.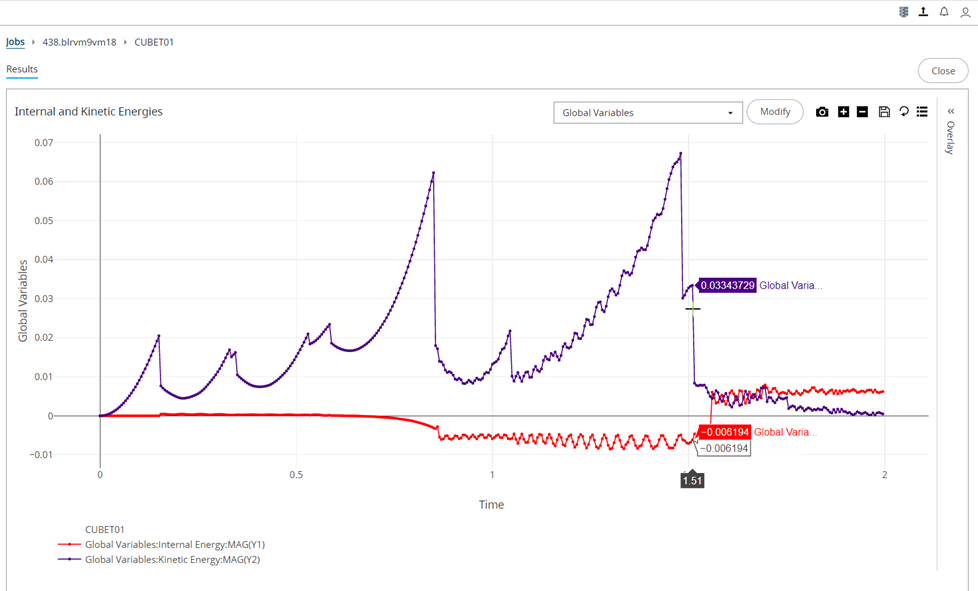
Figure: Viewing Data Points
-
Click > Show Data Points again to hide the data points.