Use the curve editor to create and plot XY curves.
From the Model ribbon, click the Curves tool.
Figure 1.
Alternatively, you can right-click in the Model Browser
and create a new Curve entity.
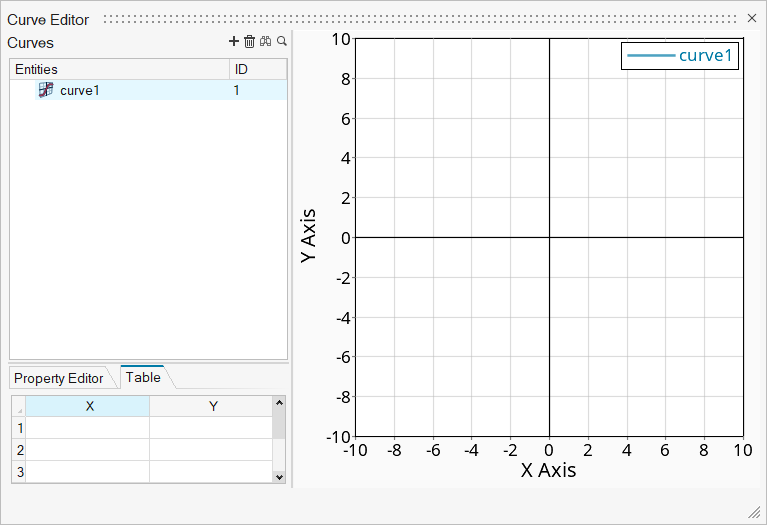
Figure 2.
Create a new curve by clicking .
To plot the curve:
Click the Table tab on the bottom half of the
browser.
Enter an x-coordinate in the X1cell.
Press Tab to move to the
Y column and enter a value for the
y-coordinate.
Press the Tab again to move down to the next
row and continue entering values as necessary.
The curve is plotted in the editor.
Choose whether to display the curve in the graph by toggling the entity icon in
the browser.
Import Data From a CSV File
Highlight the name of the curve that you want to plot.
Click the Table tab on the bottom half of the
browser.
Right-click and any cell and select Import CSV.
Browser for and select a CSV file.
Click Open.
The data is imported into the table and the curve is plotted.
Note: The CSV file is expected to have data already
sorted in 2 columns. Rows should have only numeric data. The following
data may be omitted from import: Rows with any blank cells or
alpha-numeric characters, Rows having duplicate data on the X axis, any
additional columns.
Export Data To a CSV File
Highlight the name of the curve that you want to export as a CSV.
Click the Table tab on the bottom half of the
browser.
Right-click and any cell and select Export to CSV.
Choose where to save the file and give it a name.
Click Save.
A CSV is created from the tabular data.
Edit Points On a Curve
Edit points in the following ways:
Click and drag to select any number of cells in the curve table data.
Right-click to Copy and Paste
data.
You can also copy and paste with standard keyboard shortcuts like
Ctrl + C and
Ctrl + V, as well as from
external tools such as Excel spreadsheets.
Add more points to a curve by selecting a row of data in the table,
right-clicking on row number, and selecting Insert Above
or Below.
Cut and delete entire rows using the same context menu as above.
Curve Operations
Right-click on a curve to delete,
show/hide/isolate, rename, or
create a duplicate.
You can also delete a curve by clicking , or
show/hide a curve by toggling the entity icon.
Click in a blank area on the plot then right-click and select Fit
All to fit the displayed curves in the plotting area.
You can also use the F key as a shortcut for fitting
curves.
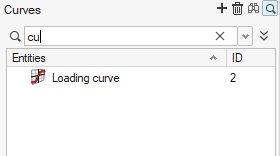
In a large list of curves, click
to search for a curve by name, or part of a name.
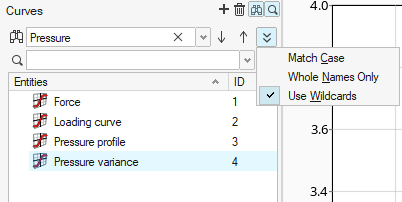
Figure 3.
In a large list of curves, click to find curves that match your naming
criteria.
You can use the arrow keys or the icons to navigate the curves matching the
criteria. You can further tweak the criteria for match case, whole names, or
wildcards using the drop-down menu.Figure 4.
Property Editor
You can change various attributes of the plot by clicking the Property
Editor tab:
Visibility
When checked, displays the curve.
Layer
When report templates are overlayed, each overlayed curve is stored in a
different layer.
Reference
The curve (and shading, if areas are shaded) moves behind the grid lines
of the plot, so that the grid lines are visible over the curve/shading.
Autofit does not apply to the curve.
Show Label
Displays the name of the curve in the upper-right corner of the
graph.
Label
The name of the curve.
Show Label Prefix
Displays a prefix before the name of the curve in the label.
Show Label Suffix
Displays a suffix after the name of the curve in the label.
Line Style
Options for displaying various line types.
Line Color
Change the color of the curve.
Line Thickness
Change the thickness of the curve.
Shade Area
Provides options for shading parts of the graph in relation to the
curve.
Symbol Style
Provides options for adding a symbol to the curve label. You can set the
style, color, frequency, and size of the symbol.

 .
.
 , or
show/hide a curve by toggling the entity icon.
, or
show/hide a curve by toggling the entity icon. to search for a curve by name, or part of a name.
 to find curves that match your naming
criteria.
You can use the arrow keys or the icons to navigate the curves matching the criteria. You can further tweak the criteria for match case, whole names, or wildcards using the drop-down menu.
to find curves that match your naming
criteria.
You can use the arrow keys or the icons to navigate the curves matching the criteria. You can further tweak the criteria for match case, whole names, or wildcards using the drop-down menu.