Debug Code
Use the Debugger to find errors in the script.
Watch Window
Use the Watch window to monitor variable values while stepping through scripts.
The Watch window is accessible only in debugging mode. And, by default, the Watch window is not displayed. Use the menu to show/hide the Watch window.
Variable names can be typed in the first column or can be dragged and placed there from the Editor. Alternatively, they can be added by highlighting them in the Editor and selecting the context menu option Add Selection to Watch. The variable’s current value (or values) is displayed in the second column and its type is displayed in the third column. The value can be overwritten by typing a new value. The changed value is used next.
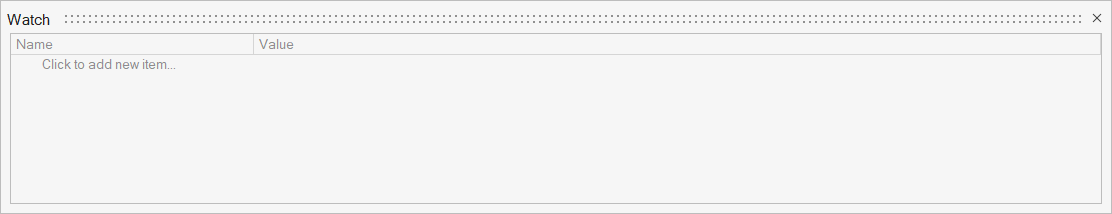
Figure 1.
Call Stack Window
The Call Stack window displays the paths traced while executing scripts.
The Call Stack window is accessible only in debugging mode. And, by default, the Call Stack window is not displayed. Use the to show/hide the Call Stack window.

Figure 2.
Breakpoints Window
The Breakpoints window displays all breakpoints in the debugging session. Each breakpoint is listed along with its host file and the line number.
The Breakpoints window is accessible only in debugging mode. And, by default, the Breakpoints window is not displayed. Use the to show/hide the Breakpoints window.

Figure 3.
Debug Scripts
Click the Debug icon to activate Debug mode.
-
From the Debug menu, select Start
Debugging, or use the Debug icon
 .
Other windows become available once Debugging Mode is activated.
.
Other windows become available once Debugging Mode is activated. -
Click Run File
 to start the debugging process.
Once a breakpoint is hit, a yellow arrow is displayed inside of it. This indicates the next line of execution.
to start the debugging process.
Once a breakpoint is hit, a yellow arrow is displayed inside of it. This indicates the next line of execution. -
Once a breakpoint is hit, select the next option:
- Click Step Over
 to execute the current line and move
over to execute the next one. The yellow arrow on the margin moves to that
point.
to execute the current line and move
over to execute the next one. The yellow arrow on the margin moves to that
point. - Click Step Until
 to resume execution until the next
breakpoint is hit in the remaining execution path or the end of script is
reached.
to resume execution until the next
breakpoint is hit in the remaining execution path or the end of script is
reached. - Click Step Into
 to enter any user written function
call at the current line of execution. If none exists, it behaves like
Step Over.
to enter any user written function
call at the current line of execution. If none exists, it behaves like
Step Over. - Conversely, click Step Out
 to come out of the current function
and to the point where the function was called.
to come out of the current function
and to the point where the function was called.
- Click Step Over