Create Plots
In Compose, you can create 2-D and 3-D plots using OML plotting commands.
OML Plots
In Compose, the OML language offers a rich set of plotting commands for both 2-D and 3-D plots.
Examples and syntax can be found in the section.
In Compose, 2-D or 3-D plots can either be displayed in the plot area, or they can be detached and floating.
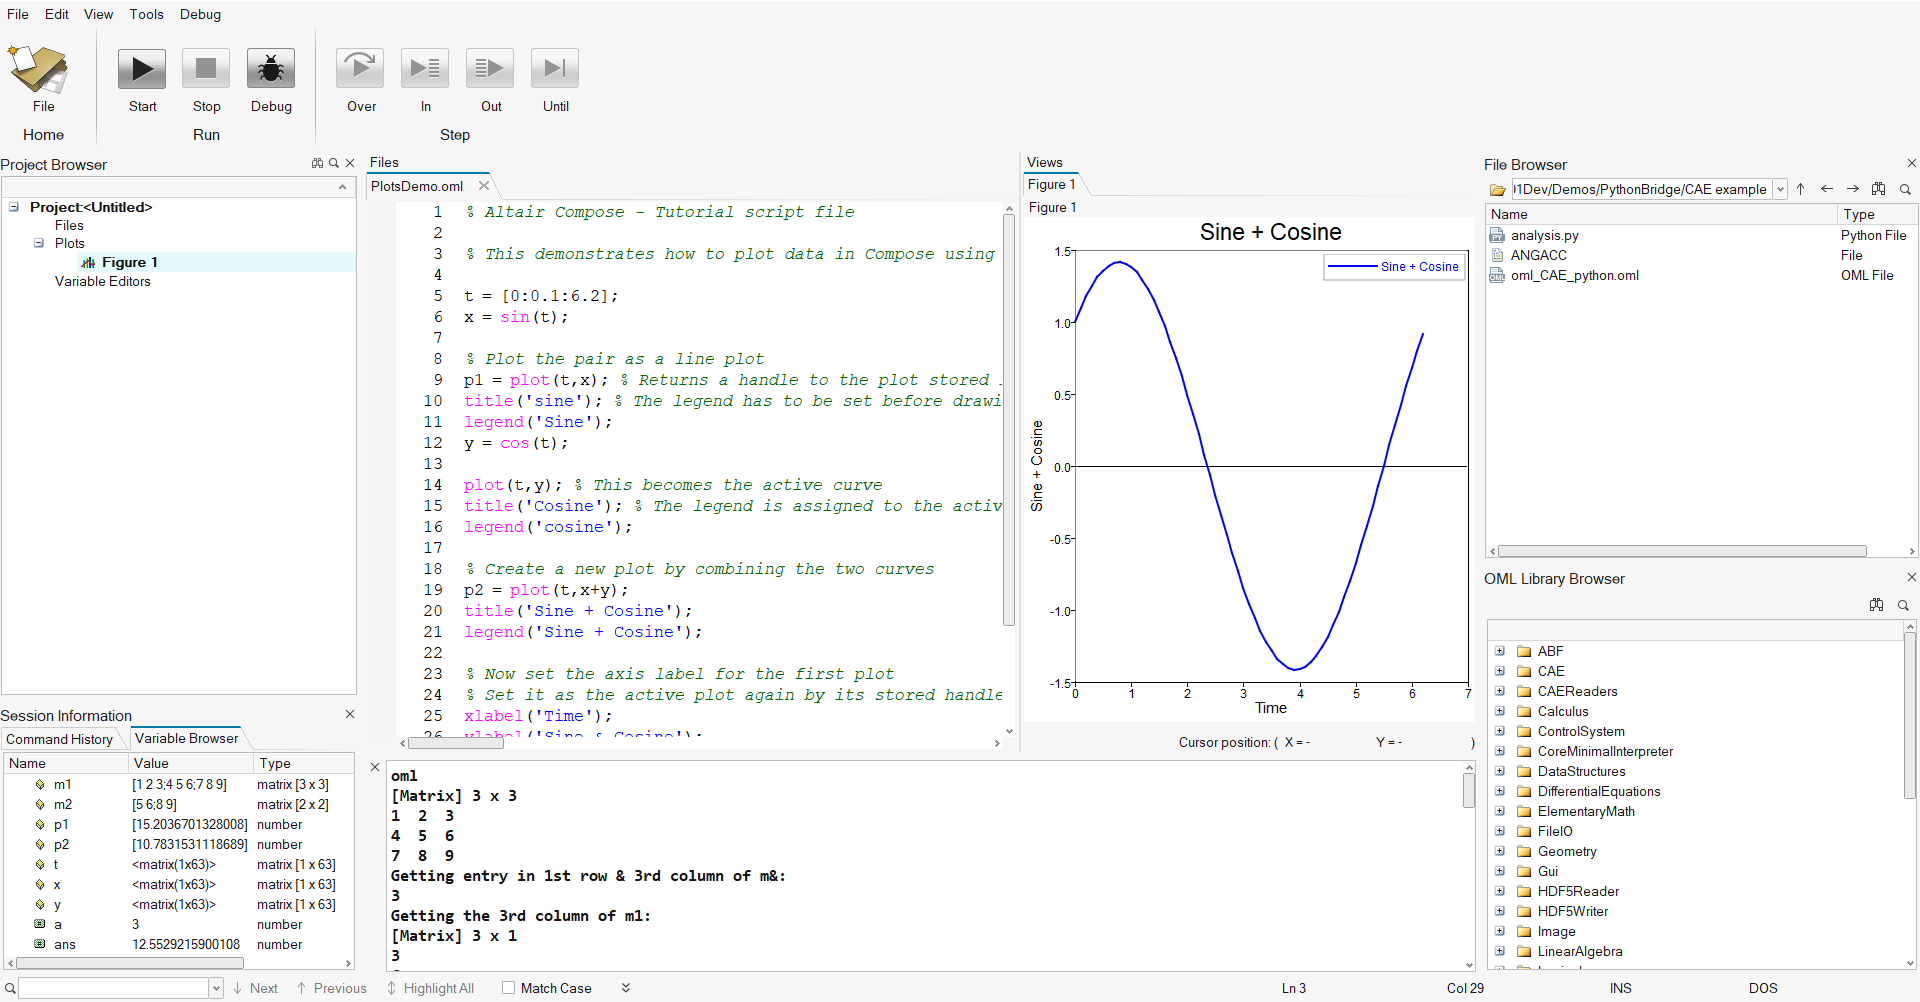 Figure 1.
 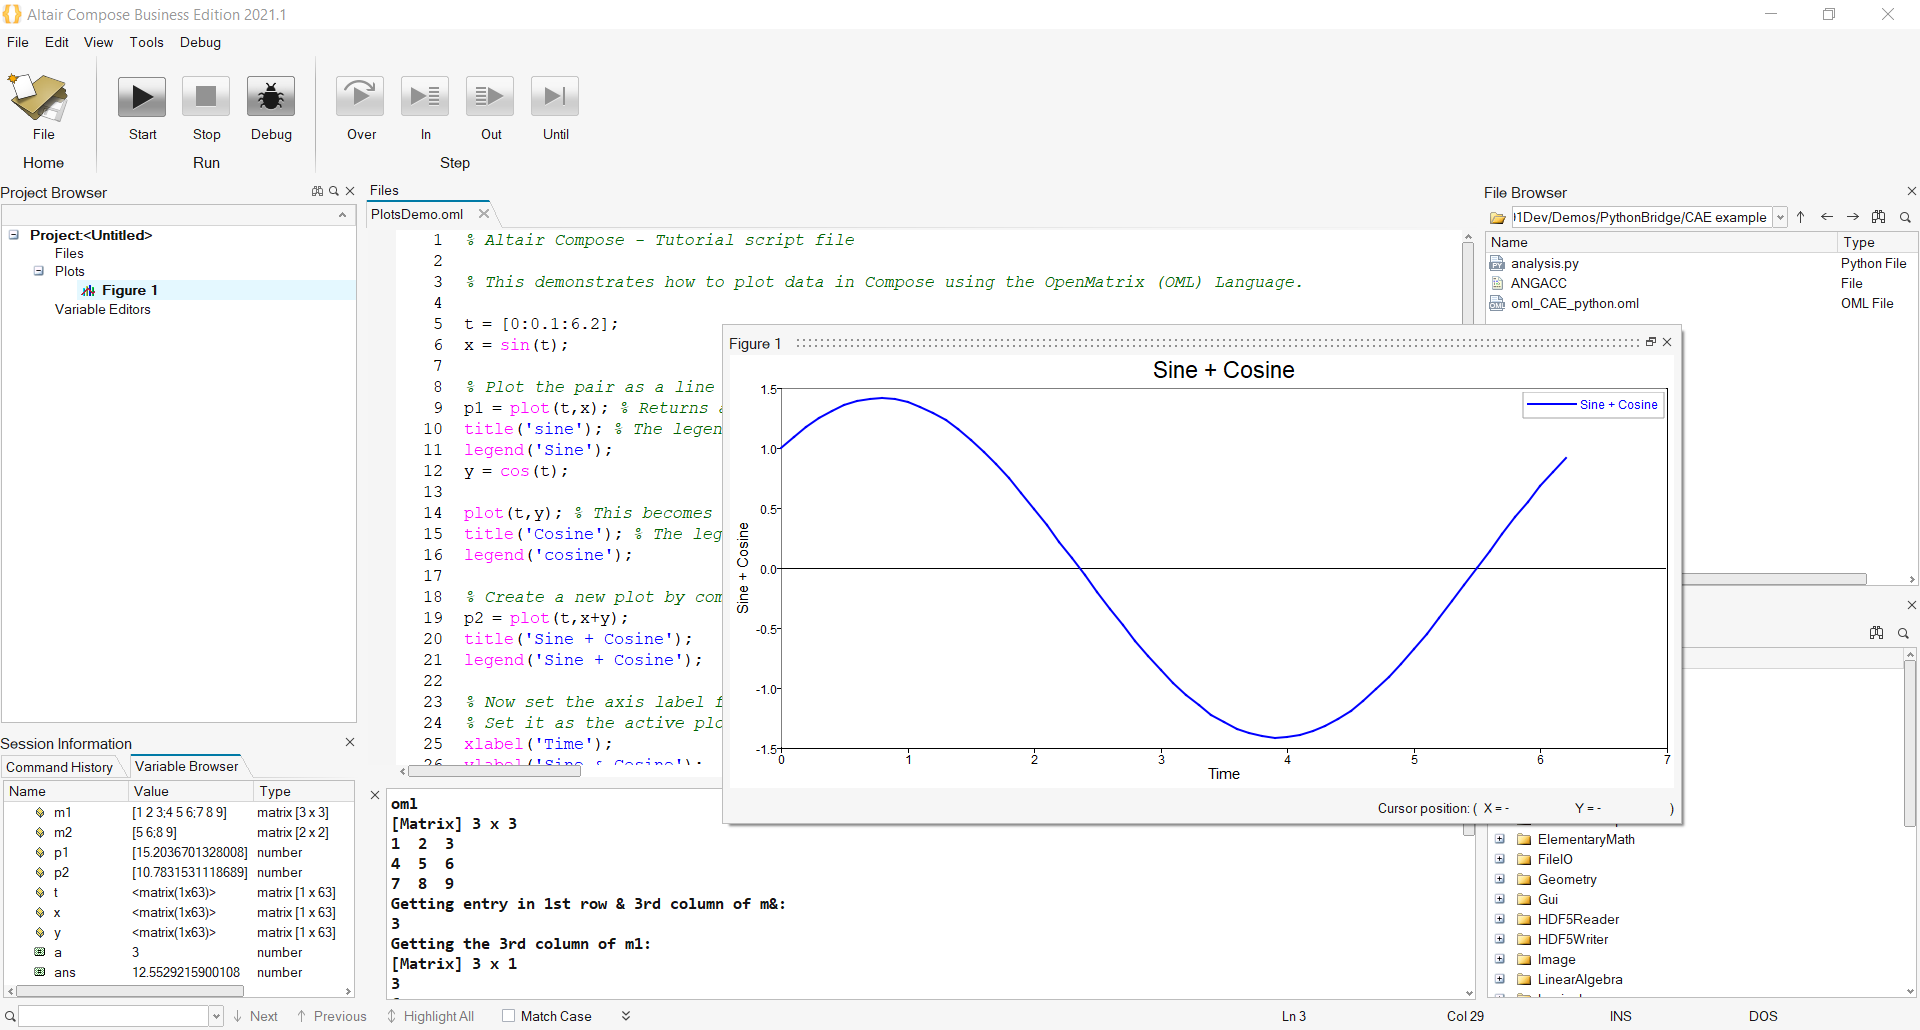 Figure 2.
 To detach a plot, click this icon, ![]() , on the figure's top border:
, on the figure's top border:
 Figure 3.
 By default, the plots are in the plot area. This can be modified in the Preferences panel:
 Figure 4.
 Plots (called figures) can be managed from the Project Browser:
 Figure 5.
 Plots in R
Compose supports R language plot commands.
The default option is to rely on the MATPLOTLIB implementation provided by R.
The following script creates the plot (floating figure) shown
below.
plot(table(rpois(100, 5)), type = "h", col = "red", lwd = 10, main = "rpois(100, lambda = 5)")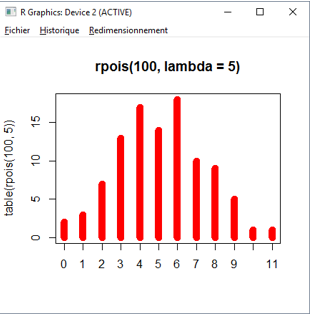
Figure 6.
The second option is to leverage the PLOTLY library in R.
For example, the following script creates data and plots it in a new Internet browser
window.
library(plotly)
x <- c(1:100)
random_y <- rnorm(100, mean = 0)
data <- data.frame(x, random_y)
p1 <- plot_ly(data, x = ~x, y = ~random_y, type = 'scatter', mode = 'lines')
pl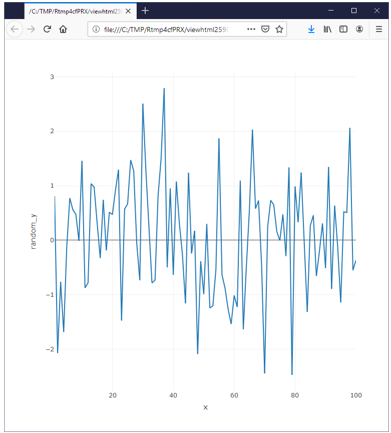
Figure 7.